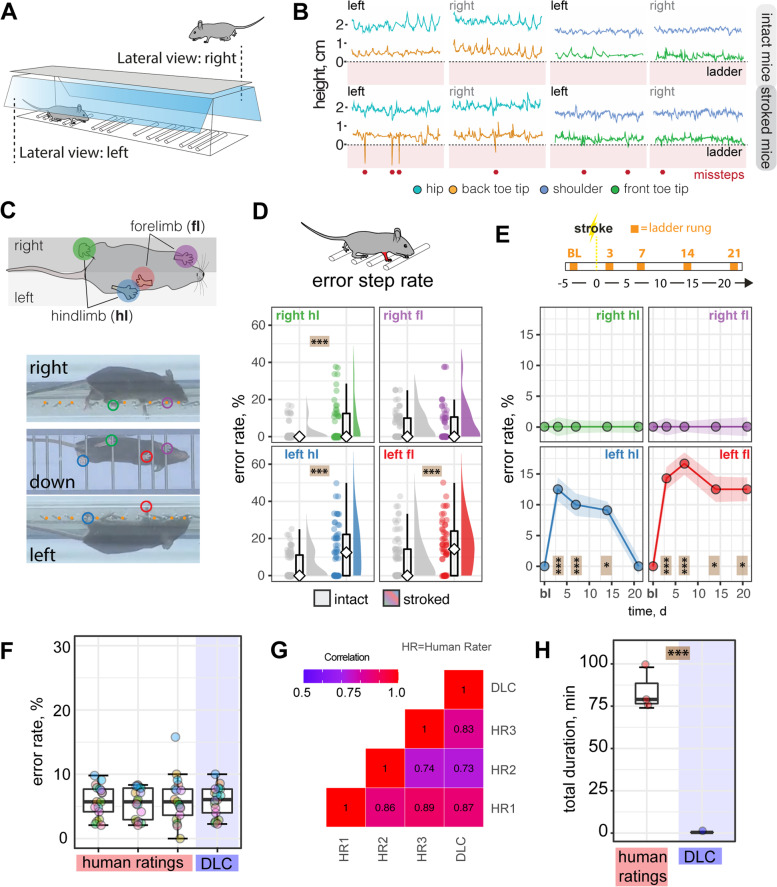
Fig. 6.
DeepLabCut assisted analysis of horizontal rung test after stroke. A Schematic view of ladder rung test. B Side view of step profile of hips, back toes, shoulder, and front toes in individual animals at baseline and 3 dpi. C Photographs of mouse from three perspectives. D Overall success and error rate in the contralesional and ipsilesional hemisphere of all paws. E Time course of error rate during ladder rung test in the individual paws. F Comparison of error rate scores in selected videos between three human observers and DLC. G Correlation matrix between human observers and DLC. H Duration of analysis for ladder rung test for 20× 10s videos. Data are shown as mean distributions where the white dot represents the mean. Boxplots indicate the 25 to 75% quartiles of the data. For boxplots: each dot in the plots represents one animal. Line graphs are plotted as mean ± sem. For line graphs: the dots represent the mean of the data. Significance of mean differences between the groups was assessed using repeated ANOVA with post hoc analysis. Asterisks indicate significance: *P < 0.05, **P < 0.01, ***P < 0.001

