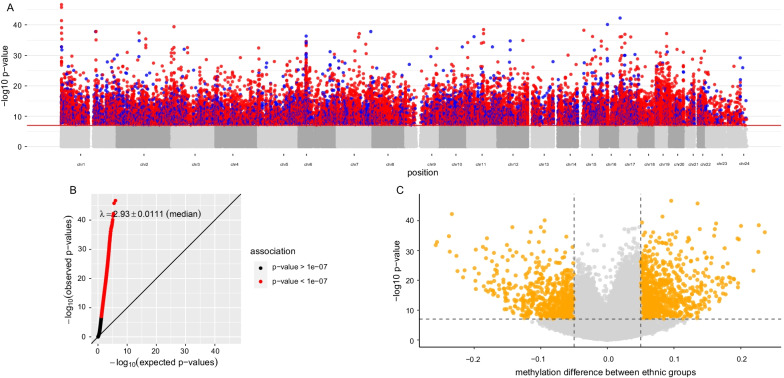
Fig. 1.
EWAS plots showing association between methylation and ethnic group in the SABRE cohort. A Manhattan plot showing association between ethnicity and DNA methylation. CpG sites with corresponding p values at ≤ 1.03 × 10⁻⁷ are colour-coded to show the direction of effect: red CpG sites are hypermethylated in South Asian individuals, while blue CpG sites are hypomethylated relative to the European group. B Q–Q plot showing observed vs expected p values from the EWAS analysis. The red line denotes equality. λ = 2.93. C Volcano plot showing p value versus effect size for each of the tested CpGs on the array. Orange highlighted CpGs are those with p < 1.03 × 10⁻⁷ and with effect sizes of > 5%

