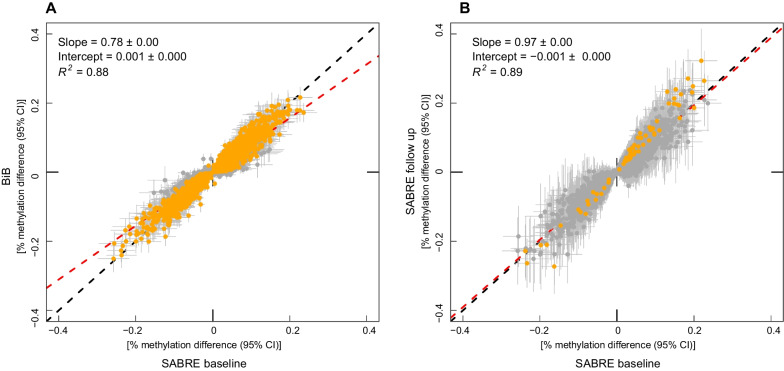
Fig. 2.
Correlation of ethnicity EWAS effect estimates between A SABRE baseline and BiB individuals B SABRE baseline and follow-up timepoints. Each CpG is represented by a point on the graph with 95% confidence intervals for effect estimates. Red dashed line: linear regression between data sets. Black dashed line: line of equality. Orange highlighted estimates: p ≤ 1.03 × 10⁻⁷ in BiB (A) or SABRE follow-up timepoint (B) EWAS. A N = 30,081 CpG sites (those associated with ethnicity from SABRE EWAS with data available in BiB. B N = 15,131 CpG sites associated with self-reported ethnicity at SABRE baseline and replicated in BiB

