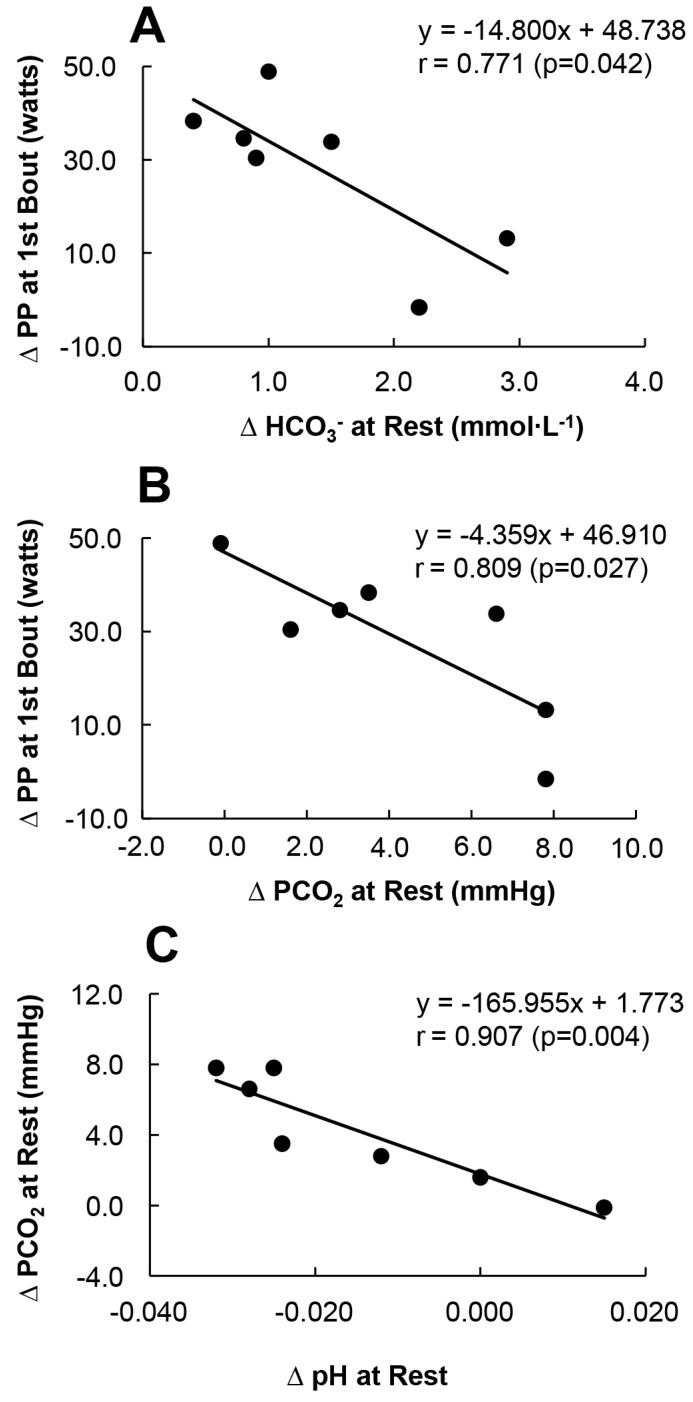
Figure 5.
The relationship between changes in the peak power (PP) at the 1st bout (ΔPP (HCP−Placebo)) and changes in the HCO3− value at rest (ΔHCO3− (HCP−Placebo)) (A), the ΔPP at the 1st bout and changes in the PCO2 at rest (ΔPCO2 (HCP−Placebo)) (B), and the ΔPCO2 at rest in relation to the changes to pH at rest (ΔpH (HCP−Placebo)) (C) in the HCP group. Note that the sample size was 7 subjects. Higher changes in ΔHCO3− and ΔPCO2 at rest were significantly negatively correlated with ΔPP at the 1st bout (r = 0.771, p = 0.042 and r = 0.809, p = 0.027, respectively), and the change in pH at rest was sensitive mainly to changes in PCO2 (r = 0.907, p = 0.004).

