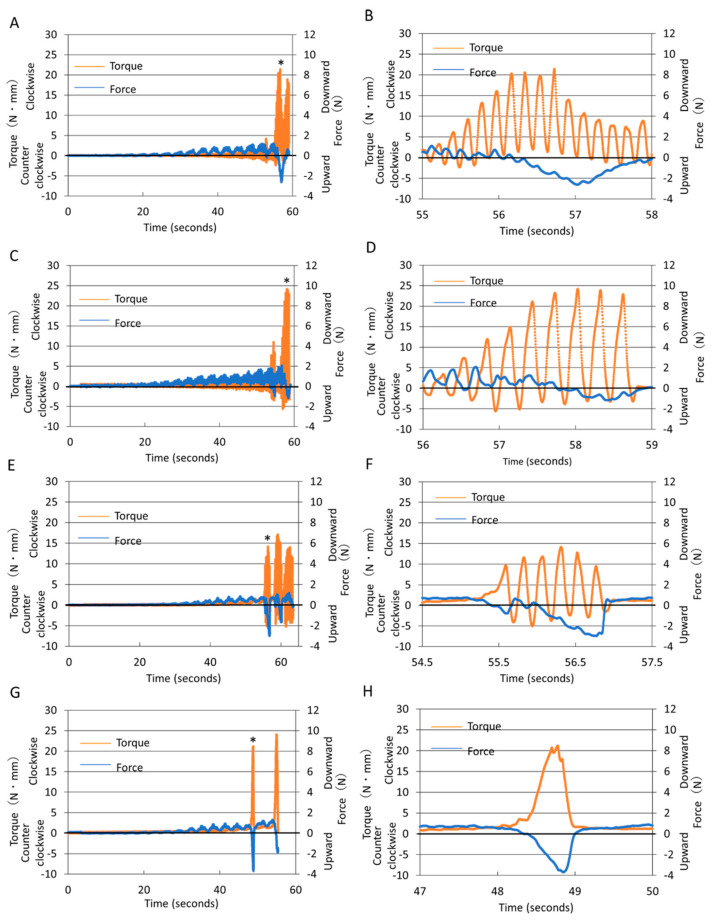
Figure 2.
Representative recordings of torque and force values during instrumentation with R150/30 (A,B), R240/120 (C,D), OTR (E,F), and CR (G,H). (B,D,F,H) Time-expanded diagrams near the maximum clockwise torque peak (*) in (A,C,E,G). Positive and negative force and torque values refer to upward and downward force and clockwise and counterclockwise torque, respectively. Labels on the x-axis indicate time (seconds) from the initiation of instrumentation.

