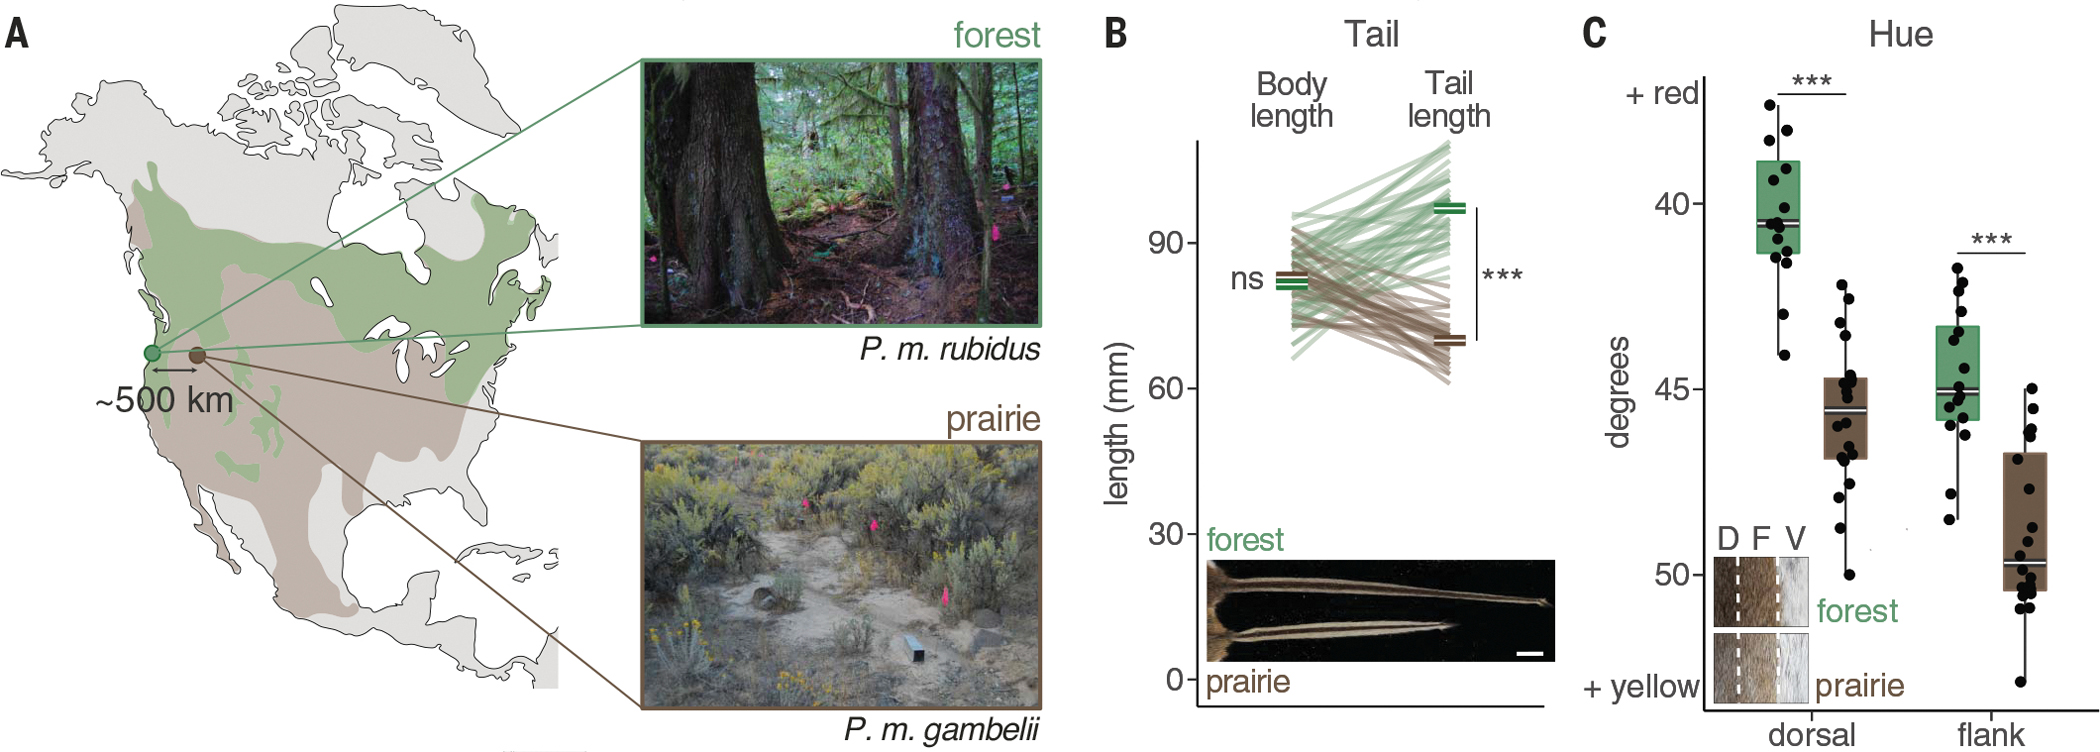
Fig. 1. Forest and prairie mice differ in tail length and pigmentation.

(A) Map shows the approximate range of forest (green) and prairie (brown) deer mouse ecotypes in North America. Collection sites of wild-caught forest (P. m. rubidus, green) and prairie (P. m. gambelii, brown) ecotypes from western and eastern Oregon, USA, respectively, are shown. Photos illustrate representative habitat; pink flags indicate trap lines. (B) Body length (left; not including the tail) and tail length (right) for wild-caught adult mice (n = 38 forest and 32 prairie). Lines connect body and tail measurements for the same individual. Means are shown in bold. (Inset) Image of a representative tail from each ecotype. Scale bar, 1 cm. (C) Coat color (hue) values for the dorsal and flank regions of wild-caught adult mice (n = 16 forest and 20 prairie). Boxplots indicate the median (center white line) and the 25th and 75th percentiles (box extents); whiskers show largest or smallest value within 1.5 times the interquartile range. Black dots show individual data points. (Inset) Dorsal (D), flank (F), and ventral (V) regions from a representative forest and prairie mouse. ns = P > 0.05; ***P < 0.001 (Welch’s t test, two-sided). Original photography in (B) and (C) is copyrighted by the President and Fellows of Harvard College (photo credit: Museum of Comparative Zoology, Harvard University).
