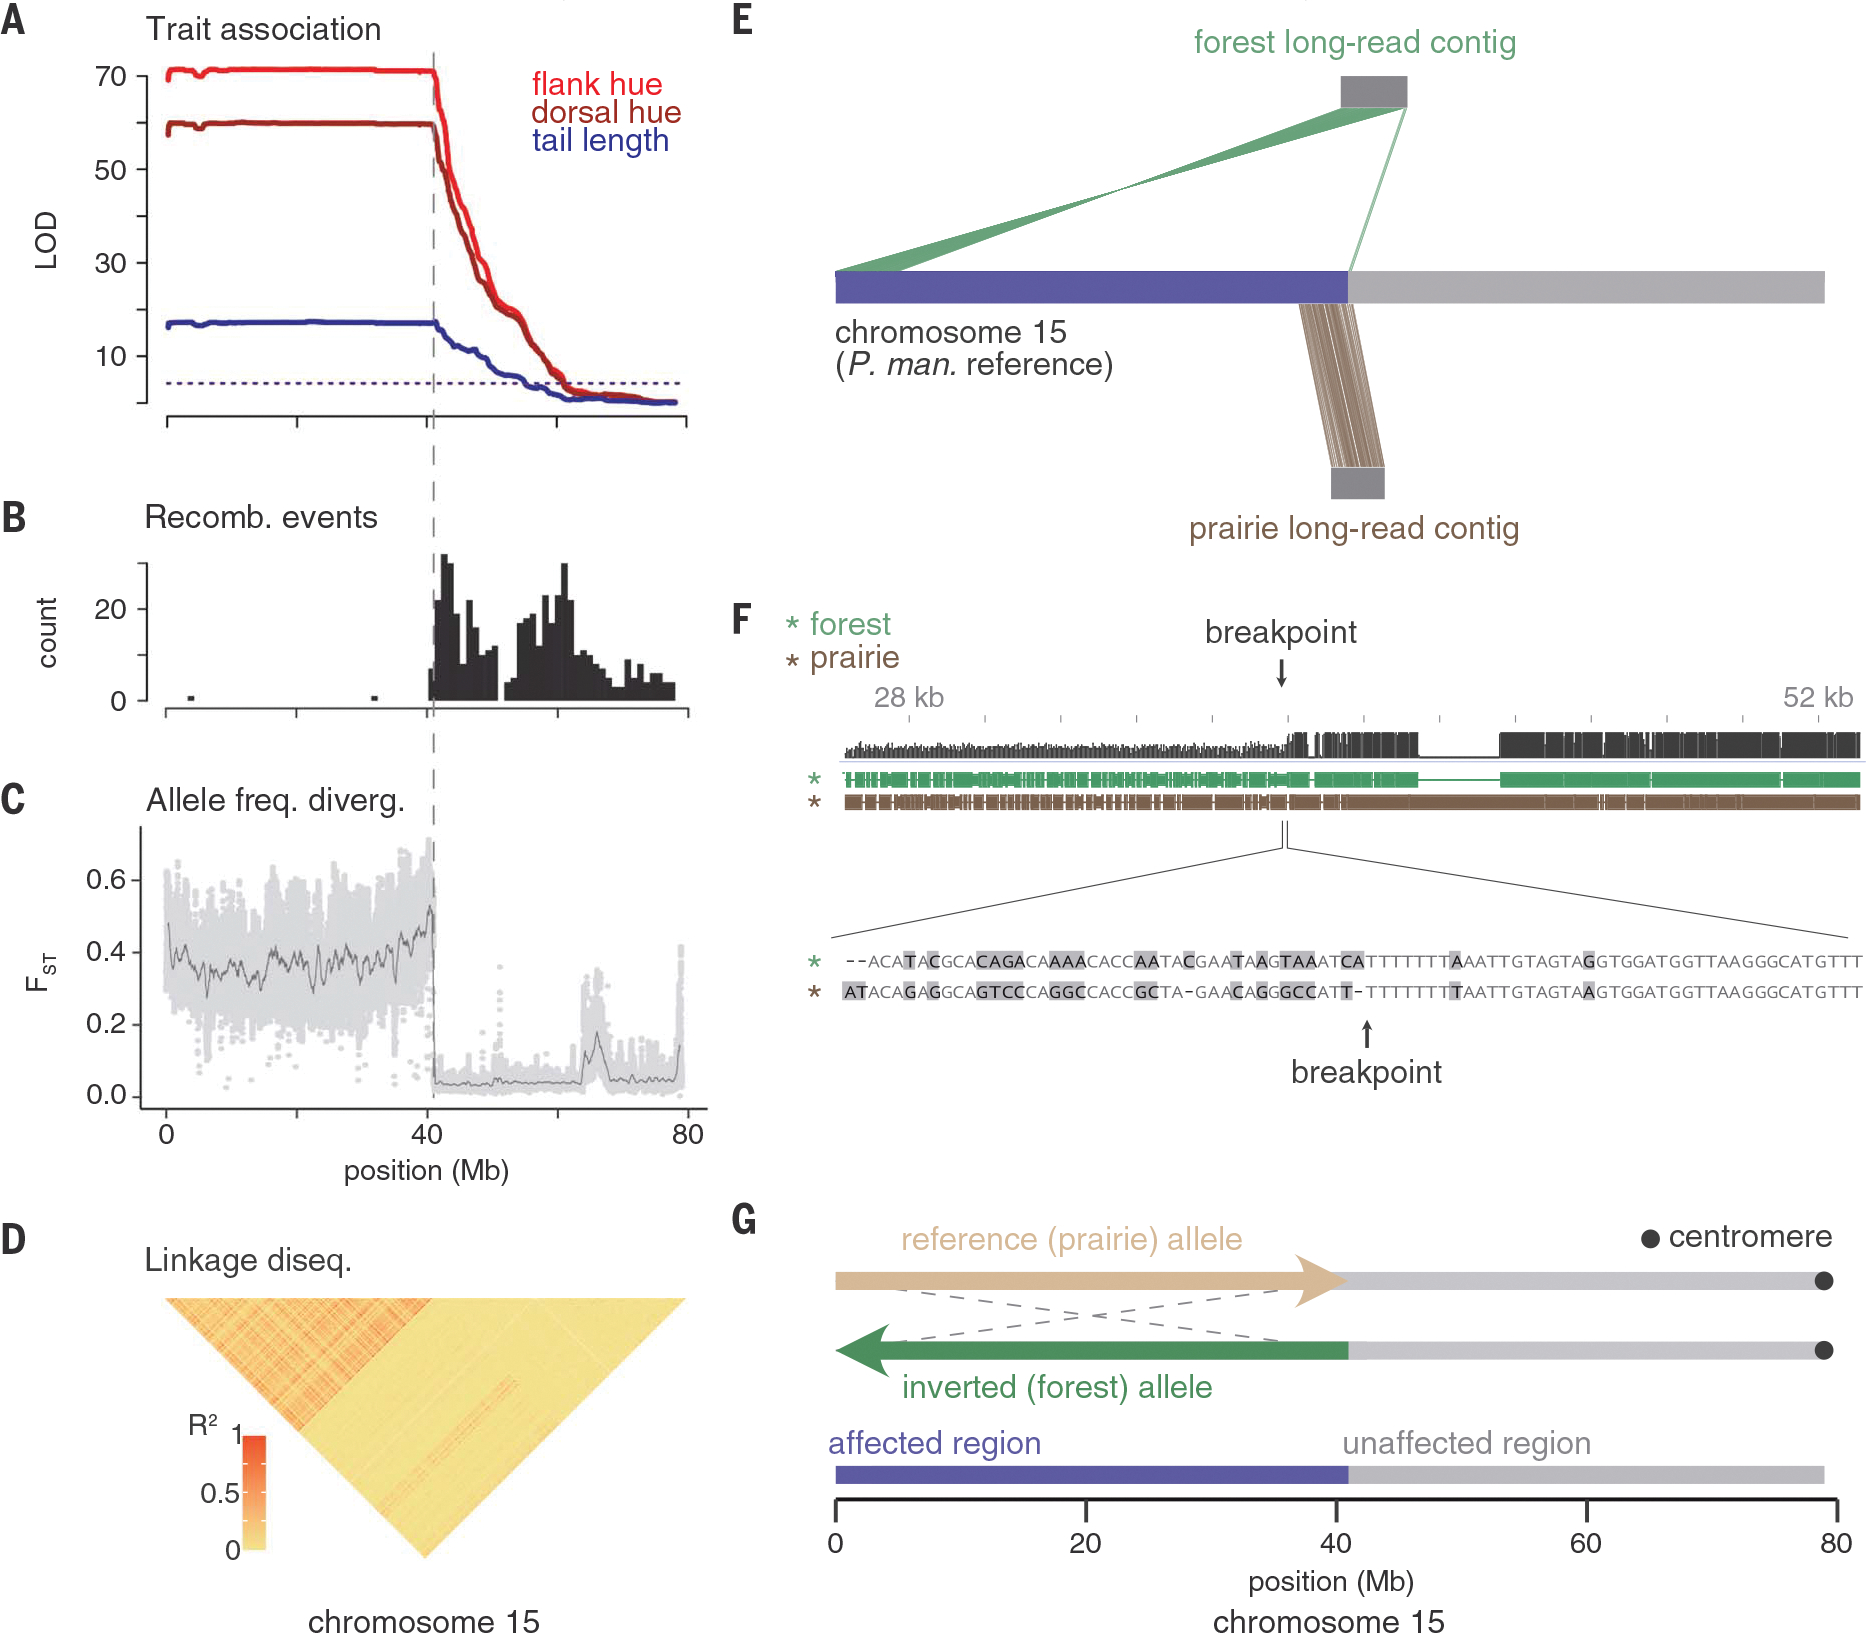
Fig. 3. Chromosomal region associated with tail length and coat color is a large inversion.

Across chromosome 15, data are from F2 hybrids [(A) and (B)] and wild-caught mice [(C) and (D), (n = 15 forest and 15 prairie)]. (A) LOD score for tail length (blue), dorsal hue (dark red), and flank hue (light red). (B) Number of recombination breakpoint events, binned in 1-Mb windows. (C) FST between forest and prairie mice estimated in 10-kb windows with a step size of 1 kb (light gray dots). Dark gray line shows data smoothed with a moving average over 500 windows. (D) Linkage disequilibrium across forest and prairie mice. Heatmap shows R2 (squared correlation) computed between genotypes at thinned SNPs (12). (E) Contigs assembled from long-read sequencing for one forest (top) and one prairie (bottom) mouse. Only contigs that span the inversion breakpoint are shown. The region of chromosome 15 affected by the inversion is highlighted (purple). (F) (Top) Alignment between regions of the forest and prairie contigs surrounding the breakpoint (black, alignment quality; green, forest contig; brown, prairie contig). Large prairie insertion near the breakpoint is a transposon. (Bottom) Base pair–level alignment around the breakpoint (gray, mismatch). (G) Model of the inverted (green) and reference (tan) alleles. The inversion spans 0 to 40.9 Mb (affected region, purple) and excludes 40.9 to 79 Mb (unaffected region, gray), with predicted centromere location shown in black.
