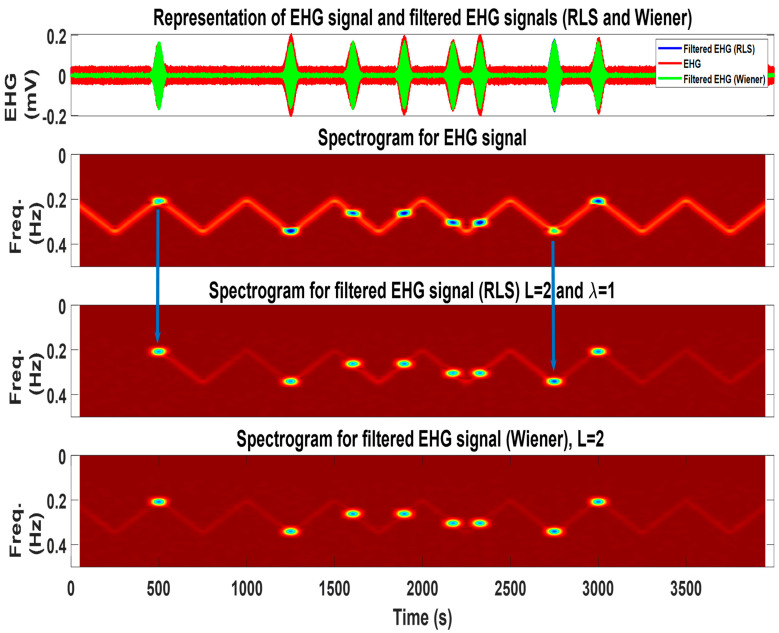
Figure 9.
In the first subplot: representation of the EHG signal with eight Alv atoms (red) and filtered output for Wiener (green) and RLS (blue) filters. The filtered Alv atoms are shown in green and blue (practically overlapped). Second subplot: the time-frequency representation of the EHG signal containing the respiration interference and eighth Alv atoms, which are visible and purposedly placed over the respiration signal. Third subplot: output of the RLS filter, where the respiration signal is attenuated and Alv waves are well-preserved. The blue arrows represent two cases, where the amplitude of the filtered Alv atoms increased after filtering (note the darker atoms’ color). This reveals a counter-phase relation between the respiratory signal and Alv waves in the original signal. Fourth subplot: output of the Wiener filter, where a further attenuation of the respiratory component can be observed. This is consistent with the obtained result, whereas the Wiener filter is the best performer.

