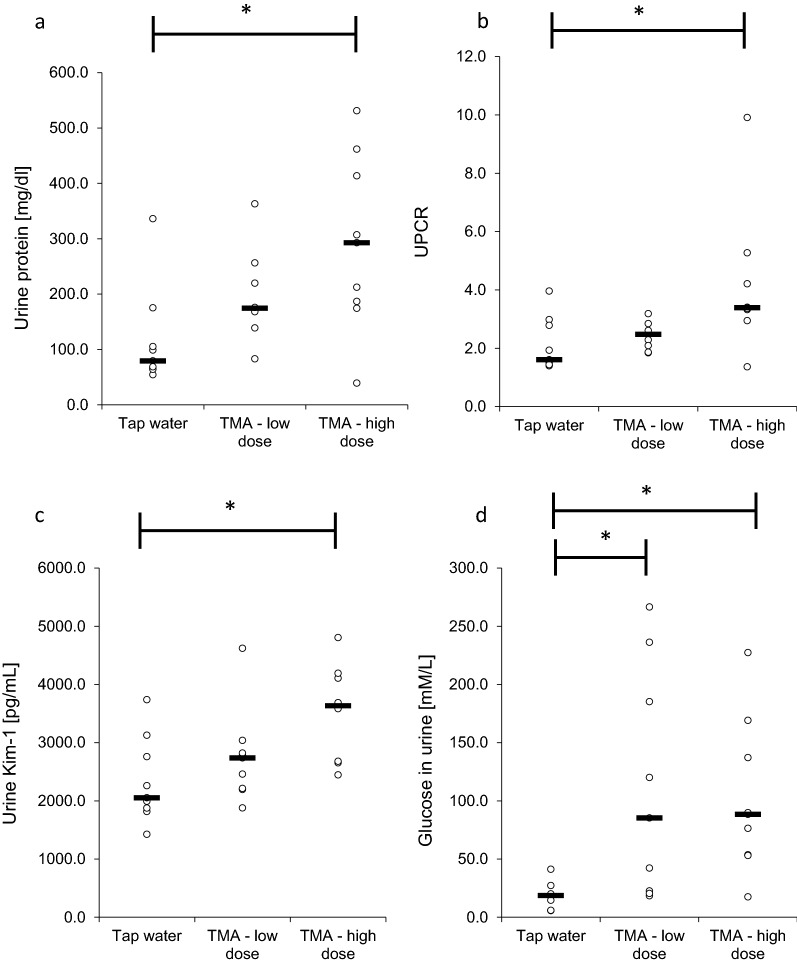
Fig. 2.
Urine biochemical analysis. a protein concentration in urine; b protein to creatinine ratio in urine; c Kim-1 concentration in urine; d glucose concentration in urine in rats maintained either on tap water (control group) or low and high dose of TMA. TMA trimethylamine, UPCR urine protein creatinine ratio. All data are expressed as the median (n = 9); Kruskal–Wallis test followed by post-hoc Dunn’s test for urine protein, UPCR and urine glucose; ANOVA followed by post-hoc Tuckey test for urine Kim-1; *P < 0.05 vs tap water group

