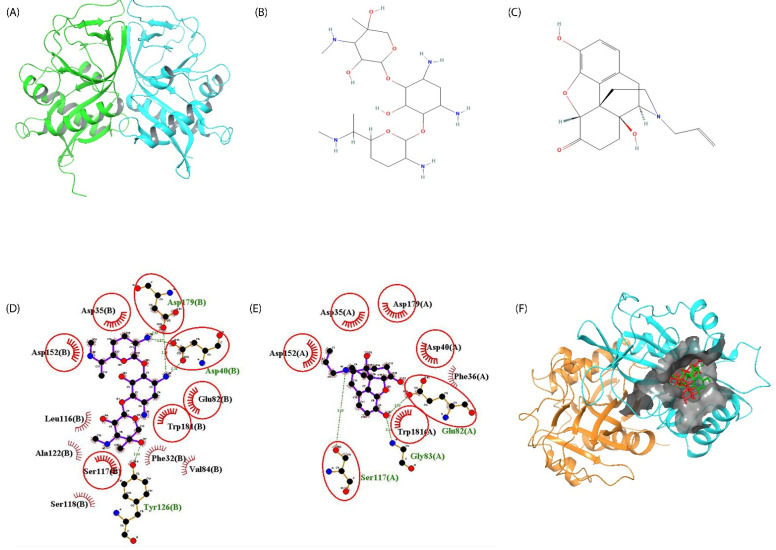
Figure 2.
Comparison of 2D interaction profile. (A) The tertiary structure of AAC2′ retrieved for protein data bank (PDB ID: 1M4I) with chain A colored in green and chain B colored in cyan. (B) Fischer projection of gentamicin. (C) Fischer projection of naloxone. (D) The surface visualization of the binding pocket in AAC2′ is shown as a gray patch on which both gentamicin (red) and naloxone (green) compounds can be visualized, binding to the same region. The images were developed using Maestro v13.2 (Schrodinger 2022-2). (E) The 2D interaction profile of gentamicin with the interactive residues of AAC2′ binding site. (F) The 2D interaction profile of naloxone with the interactive residues of AAC2′ binding site. For C and D, the residues having hydrogen bonds are showcased in atomic representations with the bond length specified in angstrom. The hydrophobic interactions are shown in the residue name with a beaming red semicircle. The common residues in both interactions are encircled in red. The plot was developed using Ligplot+.

