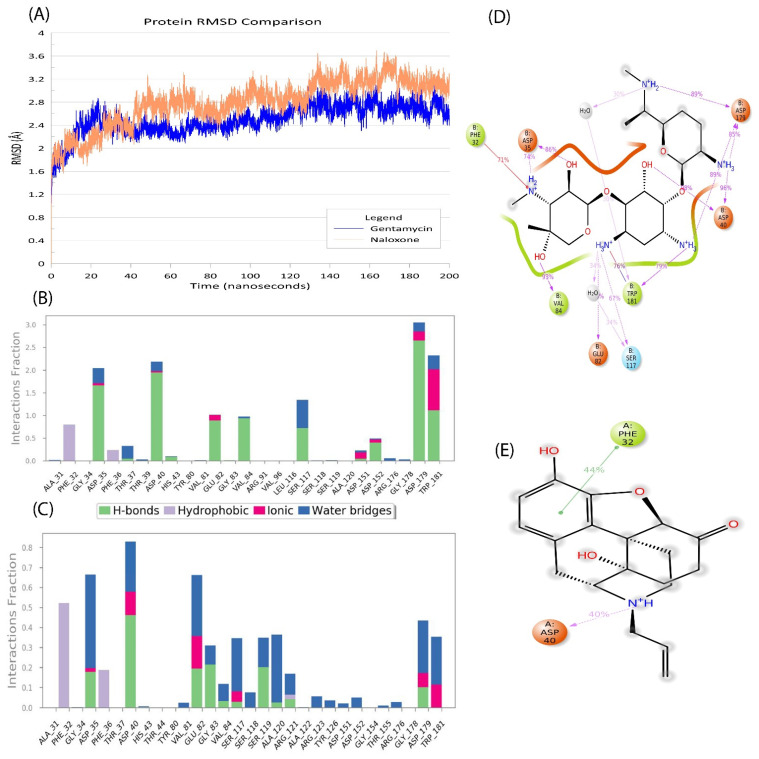
Figure 3.
Molecular dynamics simulation profile for 200 ns. (A) A root mean square deviation (RMSD) profile of gentamicin (blue) and naloxone (light orange) has been plotted against time. The time of 200 ns is shown as 10,000 frames on the x-axis and RMSD change on the y-axis. (B) The protein–ligand contacts and type of interaction for gentamicin occurring over the simulation period are shown. (C) The protein–ligand contacts and type of interaction for naloxone occurring over the simulation period are shown. For both B and C, H-bonds are green, hydrophobic interactions are light purple, ionic interactions are pink, and water bridges are blue. The stacked bar charts are normalized over the course of the trajectory; for example, a value of 0.7 indicates that the specific interaction is maintained for 70% of the simulation time. As some protein residues may have several interactions of the same subtype with the ligand, values above 1.0 are feasible. (D) The 2D profile of gentamicin interactions after the simulation period with the residues in the binding sites (E) The 2D profile of naloxone interactions after the simulation period with the residues in the binding sites. For both D and E, the color codes signify the residues in orange are negatively charged, green are hydrophobic, and light blue are polar in nature. The interactions shown in pink are pi stacking and the ones in green are hydrogen bonds. The images were developed using Maestro v13.2 (Schrodinger 2022-2).

