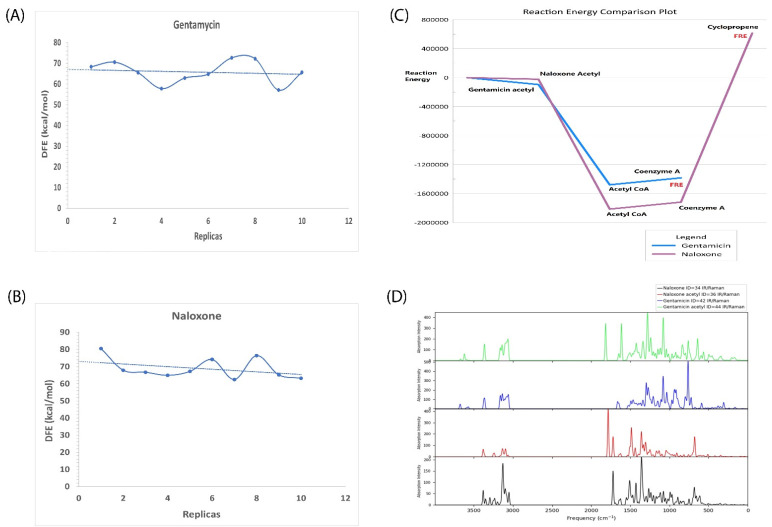
Figure 4.
Reaction energies and unbinding energy profile. (A) The dissociation free energy (DFE) values of gentamicin for each replica simulation study are shown. (B) The dissociation free energy (DFE) values of naloxone for each replica simulation study are shown. The trendline is shown in a dotted blue line. (C) The reaction energy profile of each of the reactants and products formed is plotted with in-text mentions for each of them. The final reaction energy (FRE) is in red. The reaction profile of gentamicin is highlighted in dark purple and naloxone in blue. The x-axis consists of energy values in cal/mol. (D) The IR spectra of naloxone, naloxone acetyl, gentamicin, and gentamicin acetyl are shown in black, red, blue, and green, respectively. The x-axis denotes frequency/cm with absorption intensity in the y-axis.

