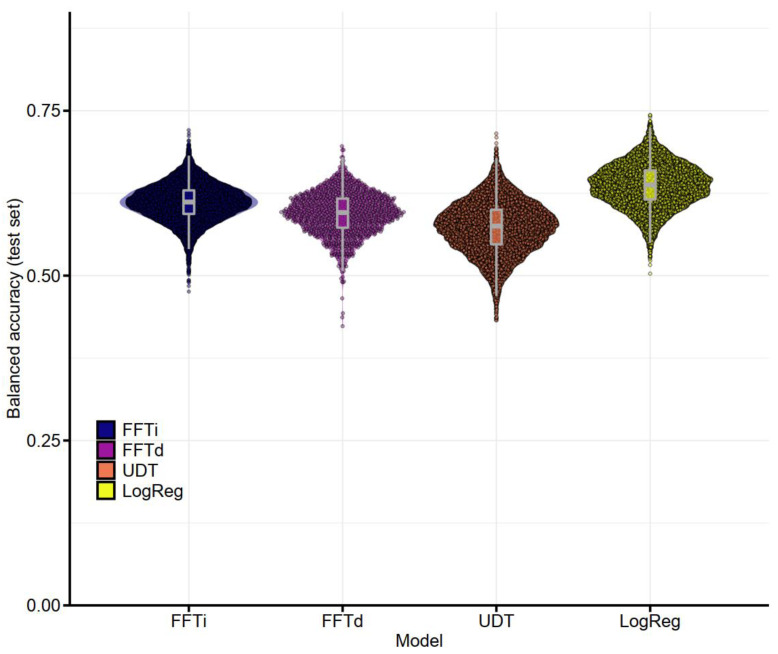
Figure 2.
Balanced accuracy in the test set (prediction task) for the four algorithms across trials with pre-operative cues only. The graph shows boxplots and violin plots, with dots representing the results of individual trials (10,000 trials for FFTi, UDT and LogReg; 1000 trials for FFTd). FFTi—fast-and-frugal tree construction using the ifan algorithm, FFTd—fast-and-frugal tree construction using the dfan algorithm, UDT—unconstrained decision tree based on the CART algorithm, LogReg—logistic regression.

