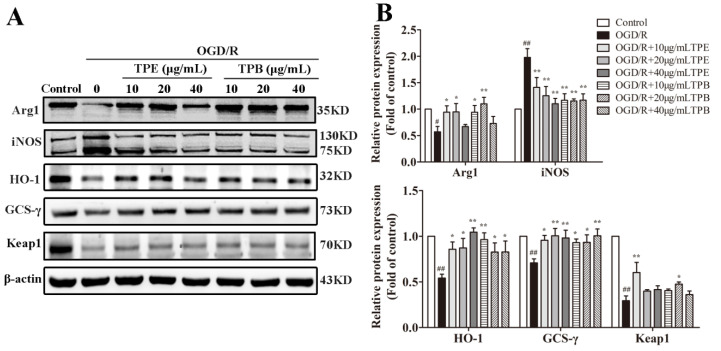
Figure 6.
OGD/R-injured cells were treated with TPE or TPB. (A) TPE and TPB concentrations on the expression of Arg1, iNOS, HO-1, GCS-γ, Keap1. (B) Relative protein values were normalized to those of the control group using a histogram. # p < 0.05, ## p < 0.01 vs. control group, * p < 0.05, ** p < 0.01 vs. OGD/R group.

