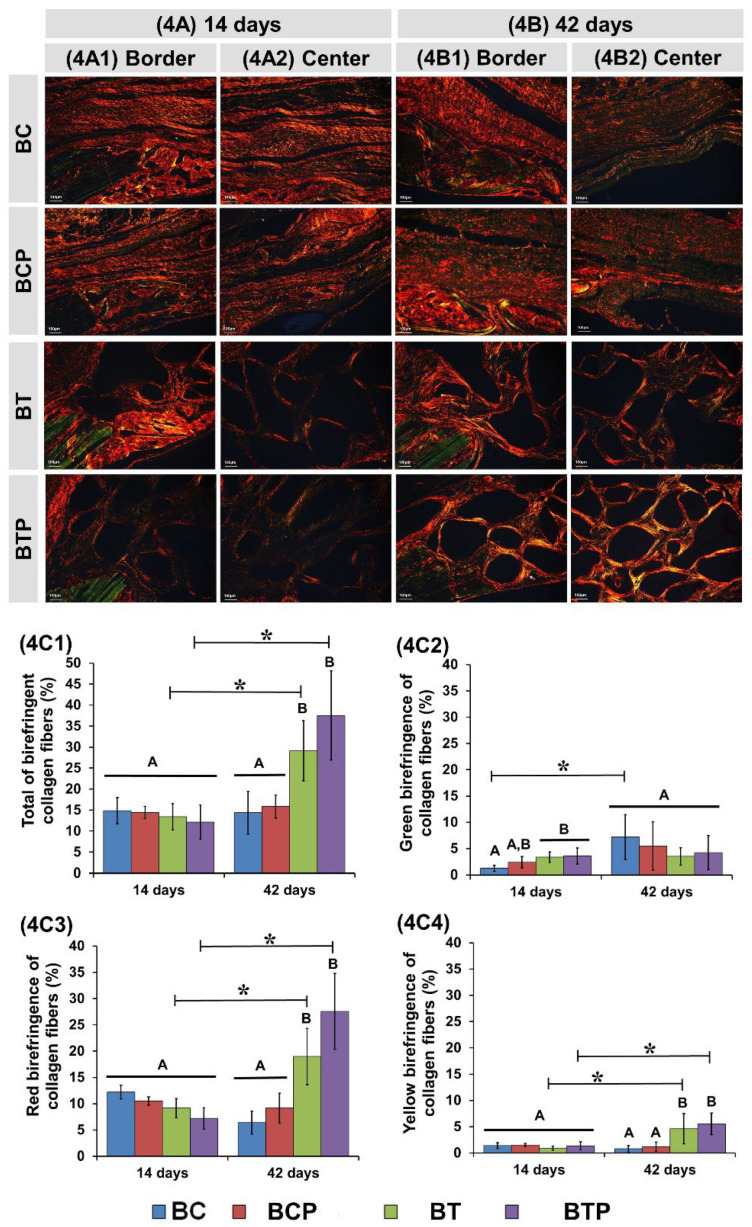
Figure 4.
Histological images of birefringent fibers stained with picrosirius red at 14 and 42 days of repair (4A–4B). Images of the defect border and in the central region in two experimental periods (4A1–4A2, 4B1–4B2). The red-orange birefringence color with immature bone formation containing thin and disorganized collagen fibers. Yellow-green color was associated with lamellar/mature bone. Original magnification 10×, scale bar 100 µm. Birefringence analysis of collagen fibers (4C): graphs of total of birefringence collagen fibers (4C1), green birefringence of collagen fibers (4C2), red birefringence of collagen fibers (4C3), and yellow birefringence of collagen fibers (4C4) in the bone tissue for each group. n = 8/group and periods (BC and BCP) and n = 10/group and periods (BT and BTP). * Standard deviation and different letters p < 0.05 between periods/group (ANOVA) and groups/period (“t” test).

