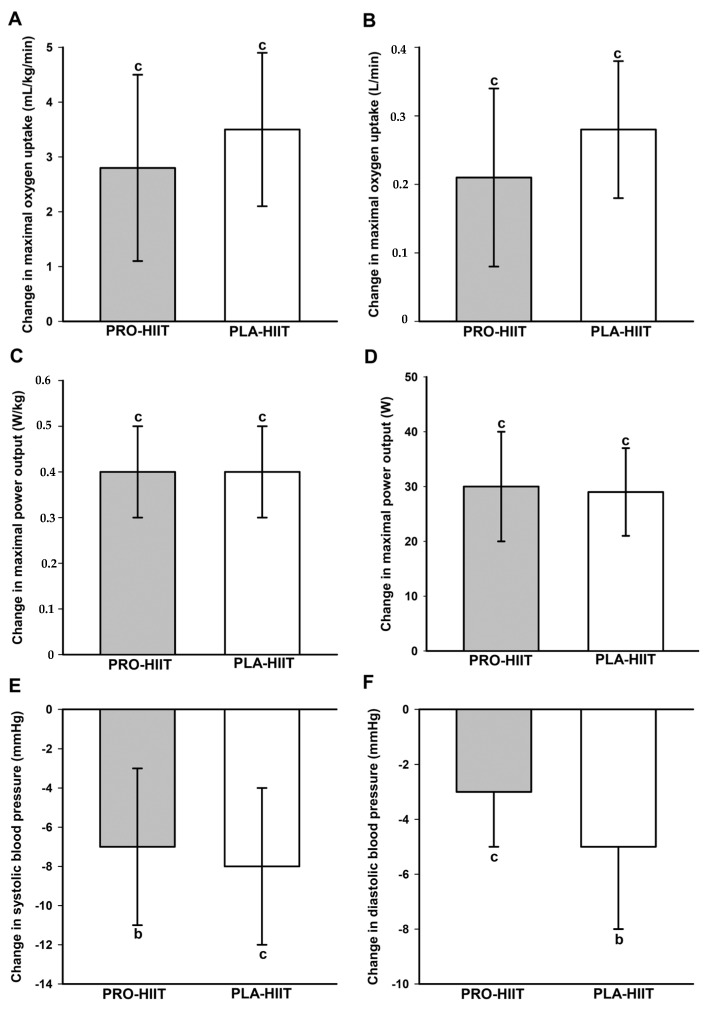
Figure 3.
Changes in relative (A) and absolute (B) maximal oxygen uptake, relative (C) and absolute (D) maximal power output, and systolic (E) and diastolic (F) blood pressure. b (p < 0.01), c (p < 0.001): significant change between pre- and post-intervention. No significant between-group differences.

