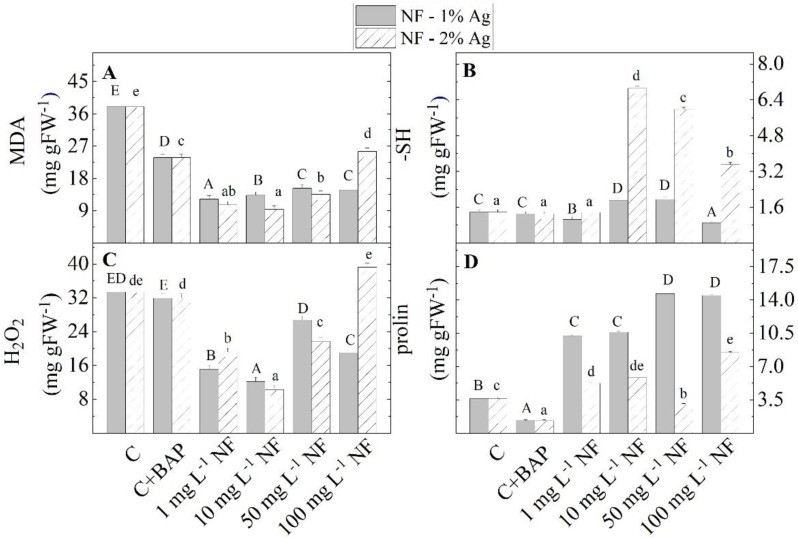
Figure 7.
The levels of stress markers (MDA (A), -SH groups (B), H2O2 (C), and proline (D)) in the S. rebaudiana plantlets in vitro propagated on MS medium, on MS medium with BAP, and on MS medium supplemented with various concentrations (1, 10, 50, 100 mg L−1) of aminoacid nanofibers enriched with 1% and 2% colloidal Ag (NF-1%Ag, NF-2%Ag). Values are means ± SE, n = 20; different letters indicate significant differences assessed by the Fisher LSD test (p ≤ 0.05) after performing ANOVA one-way analysis. We used the letter ‘a’ or “A” for the lowest data value and ascended to the next letters for higher data value. The statistical analysis of NF-1%Ag (uppercase) and NF-2%Ag (lowercase) was performed separately.

