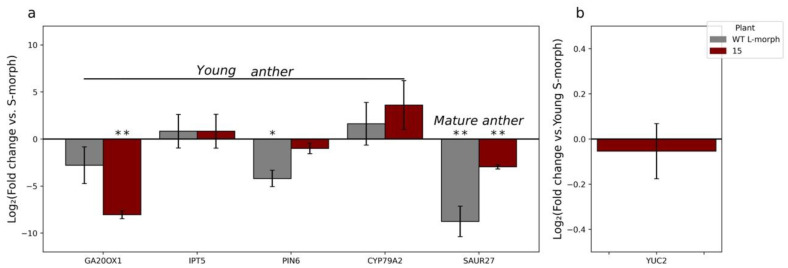
Figure 5.
RT-qPCR analysis of previously identified differentially expressed auxin-related genes in T0-15. * = p-value < 0.05, and ** = p-value < 0.01. p-values determined by Student’s t-test comparing the ∆CT of T0-15 or WT L-morph anthers, with that determined for WT S-morph anthers, at the stages as labelled. Error bars represent the standard error of the fold change. Values represent the log2(fold change). Note, (b)’s scale is extremely small compared to (a)’s scale to better represent the miniscule and insignificant difference in expression.

