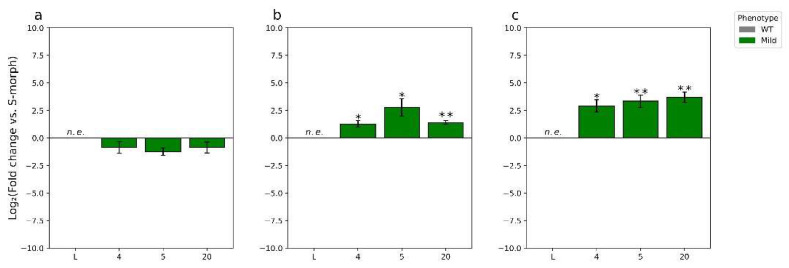
Figure 8.
RT-qPCR analysis of the expression of TjYUC6 in T1 lines compared to WT S-morph during early floral development (a), late floral development (b), and the pollen from dehisced anthers (c). N = 3 biological replicates, n.e. = not expressed, * = p-value < 0.05, and ** = p-value < 0.01. p-values determined by Student’s t-test comparing the ∆CT of the respective transgenic line with that of the WT S-morph. Error bars represent the standard error of the fold change. Values represent the log2(fold change).

