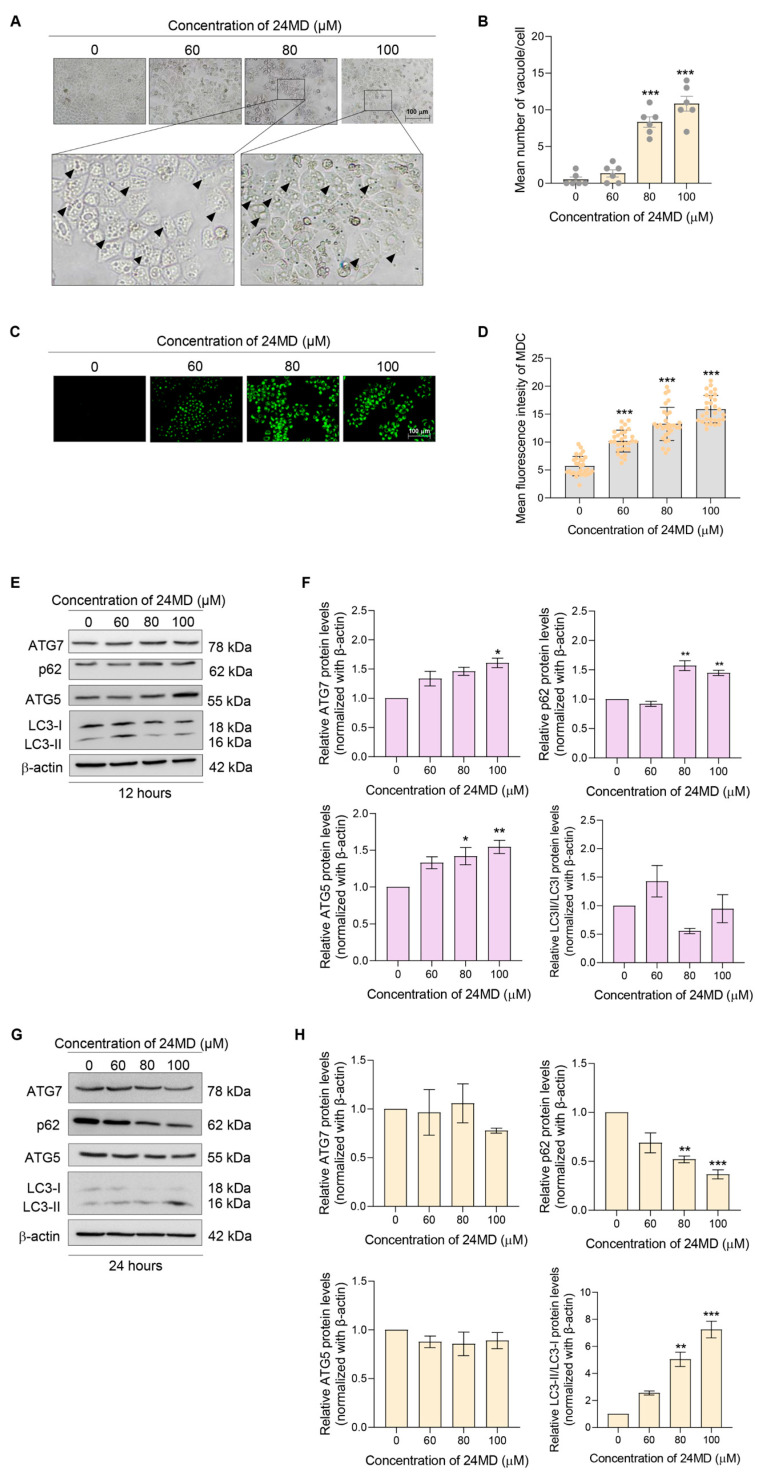
Figure 2.
Effect of 24MD on autophagy induction and autophagic flux in A549 cells. (A,B) A549 cells were treated with 24MD (0–100 μM) for 24 h. The morphological changes of the A549 cells were visualized under a phase contrast microscope, and the number of vacuoles per cells were calculated. (C,D) A549 cells were stained with MDC after treatment with various concentrations of 24MD (0–100 μM) for 24 h and visualized under a fluorescence microscope. The green fluorescence of MDC represented the autophagic vacuole. The fluorescence intensity was measured, and the relative mean intensity was calculated. (E–H) Western blot analysis was performed to assess the autophagic markers, ATG5, ATG7, p62 and LC3B after 24MD treatment for 12 h and 24 h in A549 cells. β-actin protein was measured to confirm equal loading in each sample. The densitometry of each protein levels was calculated, and the results were demonstrated in relative protein levels. Data represent the mean ± SEM (n = 3) (* 0.01 ≤ p < 0.05, ** 0.001 ≤ p < 0.01 and *** p < 0.001 when compared with non-treatment control).

