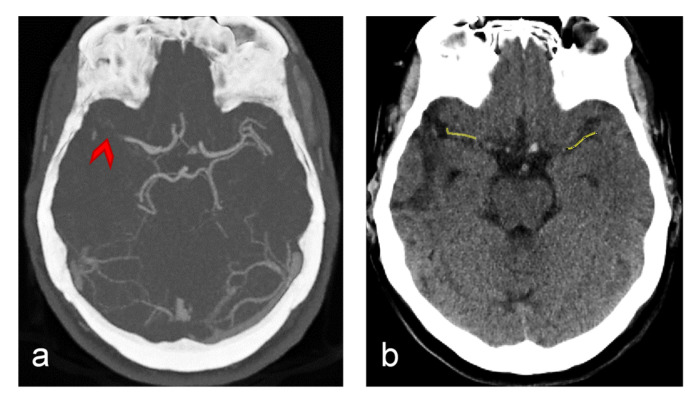
Figure 2.
Representative brain CT images of an ischemic stroke patient in a slice with the middle cerebral (MCA) artery: (a) CT angiograph (CTA) image and (b) non-contrasted CT (NCT) image of the same slice. Red arrow in the CTA image points to the occlusion (thrombus), while yellow lines in the NCT image correspond to the lines along which HU values were measured in the occluded site (left) and in the symmetrical positioned non-occluded site (right).

