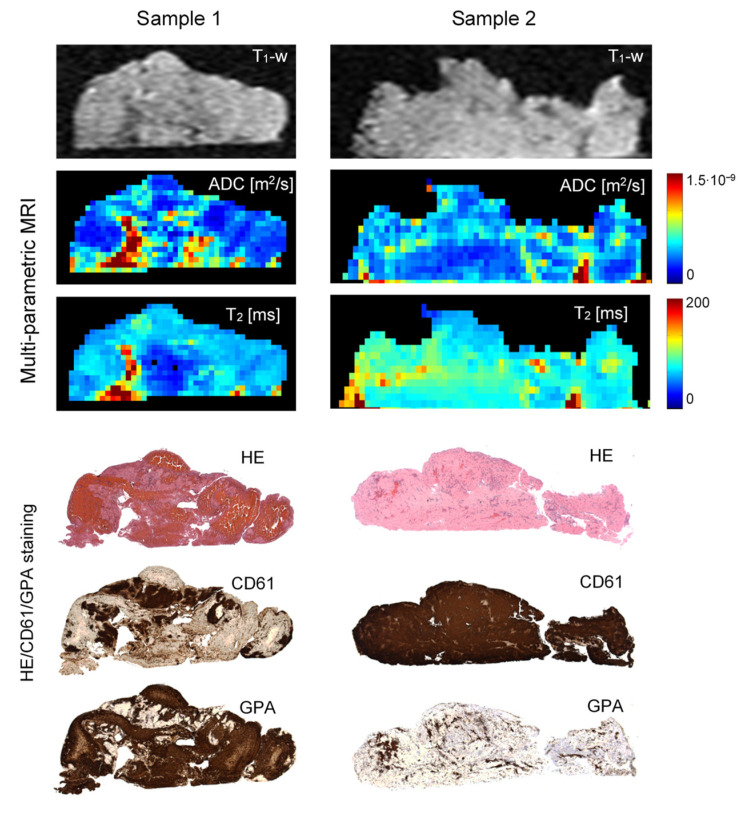
Figure 3.
Two representative cerebral thrombi of a different structure are presented by central-slice T1-weighetd images, ADC and T2 maps along with the corresponding histological (HE/CD61/GPA) images. Lower ADC and T2 values, shown in dark blue, in maps of Sample 1 correspond to compact RBC-rich regions, while lower ADC and T2 values in Sample 2 correspond to compact platelet-fibrin-rich regions. CD61 staining is specific to platelets (dark brown), while GPA staining is specific to RBC components (dark brown).

