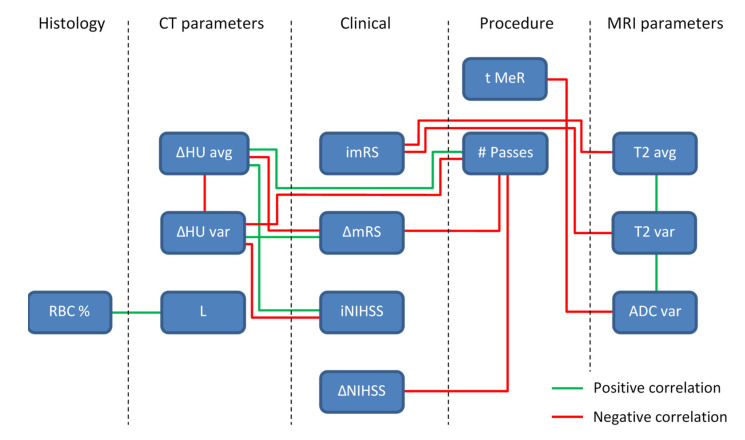
Figure 5.
A diagram of significant correlations among different thrombi parameters. The parameters are organized according to their category in histology, CT, clinical, procedure and MRI parameter groups and existing correlations between parameter pairs are plotted with a green line for positive correlations and a red line for negative correlations.

