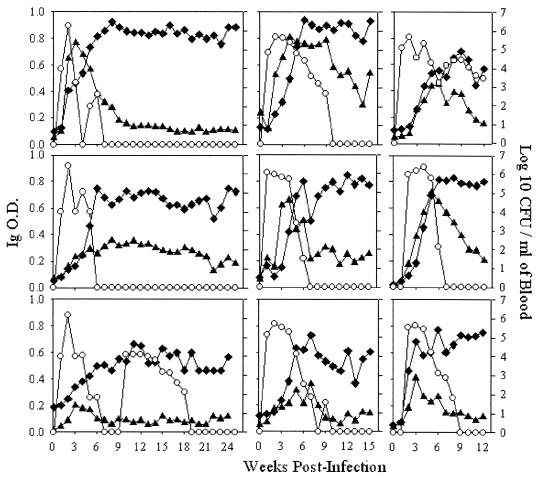
FIG. 1.
Bacteremias and antibody responses of nine cats experimentally infected with B. henselae LSU16. The OD (primary y axis) for IgM (▴) and IgG (⧫) were determined by ELISA. The OD value at each time point are the averages of triplicate wells. Bacteremia levels (○); secondary y axis) are also shown. Bacteremia levels and antibody responses were followed for 25 weeks postinfection in cats 37 and 40; 24 weeks postinfection in cat 58; 15 weeks postinfection in cats 39, 50, and 54; and 12 weeks postinfection in cats 182, 184, and 223.

