Figure 1.

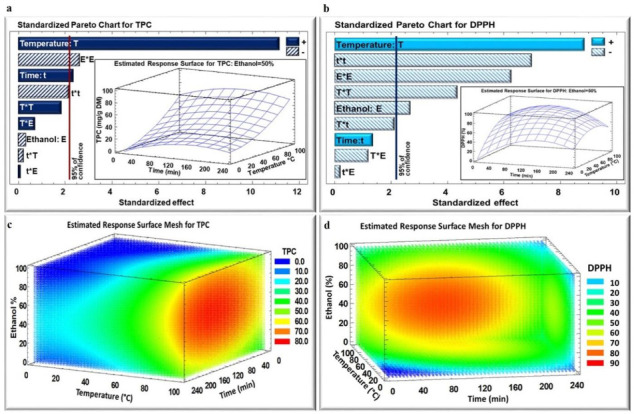
Standardized Pareto Chart for TPC (a) and DPPH (b) inhibition percentage for IR extraction, and estimated response surface Mesh for TPC (c) and DPPH (d) inhibition percentage. (+) indicates positive effect, (−) indicates negative effect.

Standardized Pareto Chart for TPC (a) and DPPH (b) inhibition percentage for IR extraction, and estimated response surface Mesh for TPC (c) and DPPH (d) inhibition percentage. (+) indicates positive effect, (−) indicates negative effect.