
Figure 2.
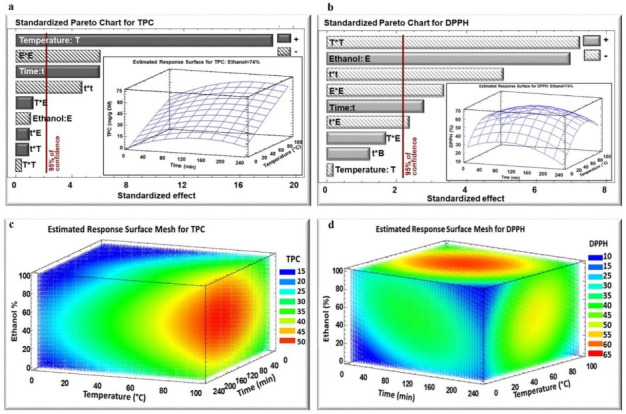
Standardized Pareto Chart for TPC (a) and DPPH (b) inhibition percentage for WB extraction, and estimated response surface Mesh for TPC (c) and DPPH (d) inhibition percentage. (+) indicates positive effect, (−) indicates negative effect.
Official websites use .gov
A
.gov website belongs to an official
government organization in the United States.
Secure .gov websites use HTTPS
A lock (
) or https:// means you've safely
connected to the .gov website. Share sensitive
information only on official, secure websites.
Standardized Pareto Chart for TPC (a) and DPPH (b) inhibition percentage for WB extraction, and estimated response surface Mesh for TPC (c) and DPPH (d) inhibition percentage. (+) indicates positive effect, (−) indicates negative effect.