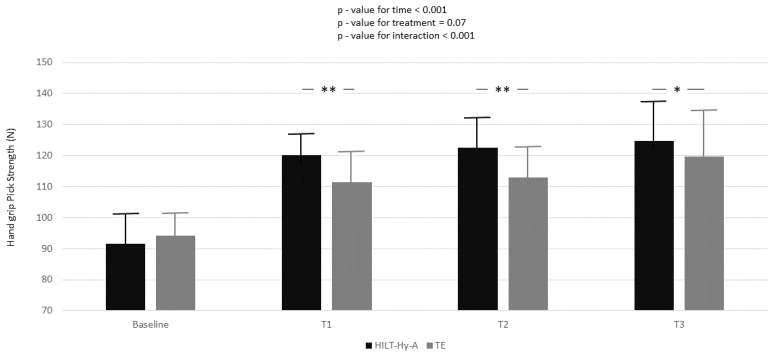
Figure 1.
Handgrip peak strength variation according to time and treatment; black box represents high-intensity laser therapy plus hyaluronic acid (HILT + Hy-A) group, whereas grey box represents therapeutic exercise (TE). Results for the linear mixed model analysis (p-values for time, treatment, and interaction of time for treatment); Bonferroni adjustment for multiple comparisons were also applied between follow-ups of study compared to baseline; *: p < 0.05; **: p < 0.001.

