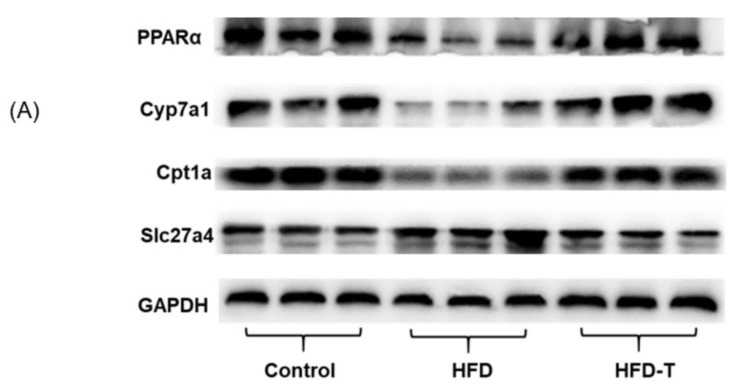
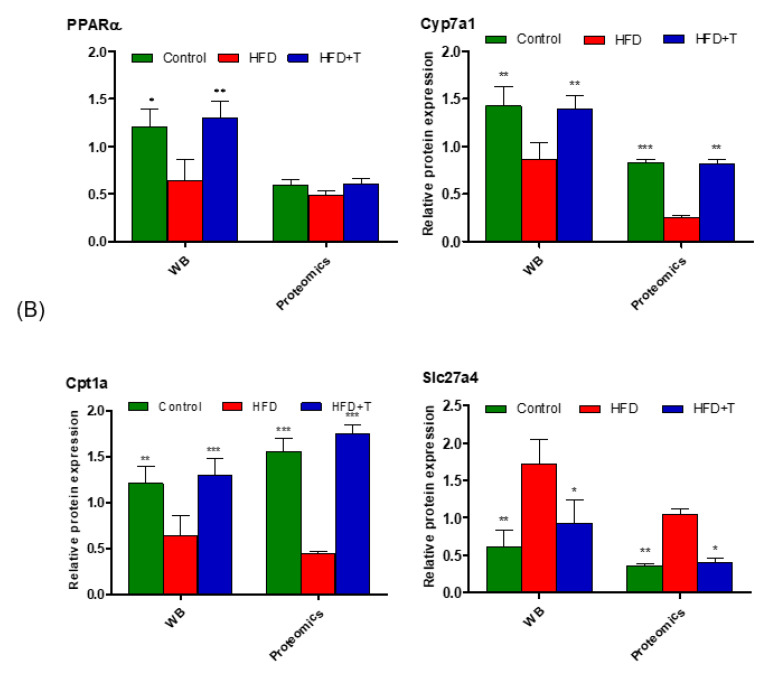
Figure 11.
The expression of representative proteins affected by Torularhodin (vs. HFD group). (A): Representative photographs of western blots; (B): Relative expression levels of proteins from western blot (WB) and proteomics data (Proteomics). The measured data are expressed as mean ± SD (n = 3). *: p < 0.05, **: p < 0.01, ***: p < 0.001 (compared to HFD within the group).


