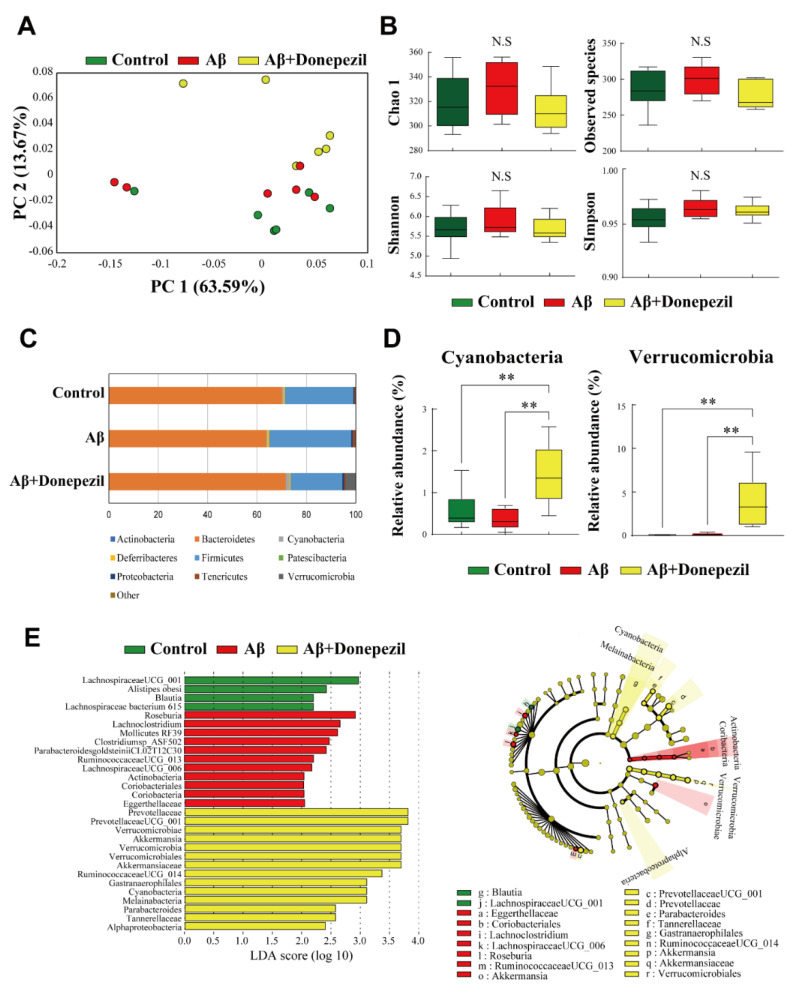
Figure 2.
(A) Beta diversity analysis of the control, Aβ, and Aβ + donepezil groups based on weighted UniFrac distance matrices. (B) Alpha diversity analysis of the control, Aβ, and Aβ + donepezil groups. (C) Comparison of microbiota composition at the phylum level. (D) Relative abundance of cyanobacteria and Verrucomicrobia. (E) Linear discriminant analysis (LDA) and the cladogram show the phylogenetic distribution of microbes that are associated with the control, Aβ, and Aβ + donepezil groups. Taxonomic levels of the phylum, class, and order are labeled, while family and genus are abbreviated. Plots are represented using LDA effect size (LEfSe). **, p < 0.01.

