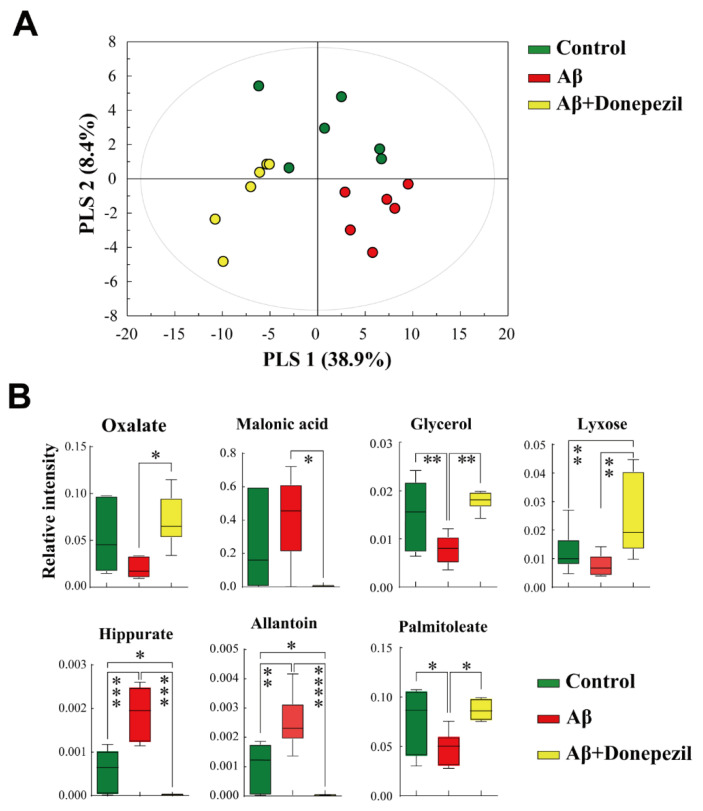
Figure 4.
(A) Supervised partial least squares discriminant analysis (PLS-DA) score plot derived from gas chromatography-mass spectrometry (GC-MS) data of feces. (B) Box plots of significantly different metabolites in feces. *, p < 0.05; **, p < 0.01; ***, p < 0.001; ****, p < 0.0001. A false discovery rate (FDR) of 5% was applied to all tests to correct for multiple testing.

