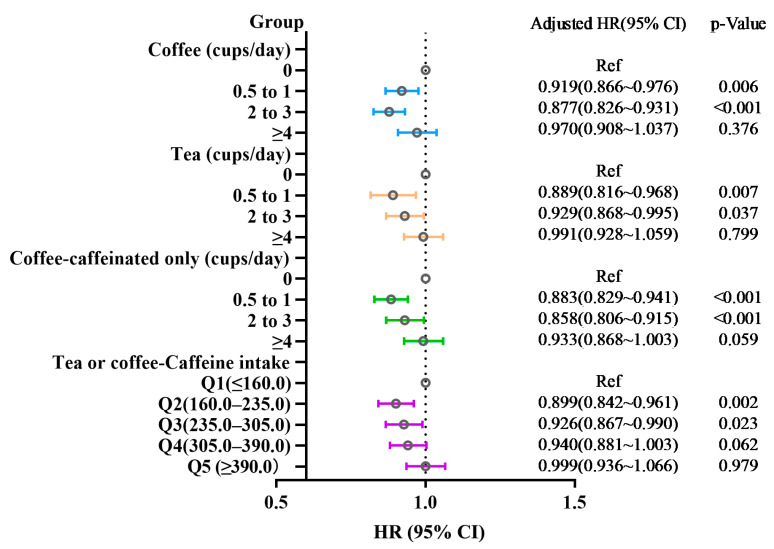
Figure 3.
Summary of hazard ratios and 95% confidence intervals (x-axis) for cups per day categories and linear trend for coffee, tea, caffeinated coffee, and combination caffeine intake from coffee and tea for adult-onset asthma. The model is adjusted by age, gender, race, BMI, smoking status, education, and Townsend Index, and adjusted for coffee in tea analysis or for tea in coffee analysis. Hatched vertical line indicates the null reference value of ‘1′.

