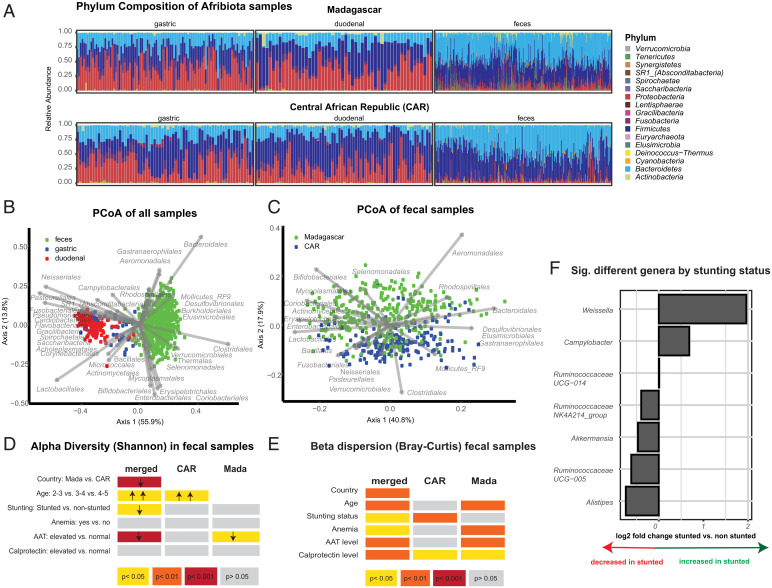
Fig. 1.
Differences in the fecal microbiota induced by different clinical cofactors. (A) Relative phylum abundance of the different samples analyzed in this study. (B) PCoA (Principal Coordinate Analysis) on the Bray–Curtis dissimilarity index of the samples rarefied to 5,000 sequences. Gastric samples: n = 212; duodenal samples: n = 137; fecal samples: n = 634. (C) PCoA on the Bray–Curtis dissimilarity index of the fecal samples rarefied to 5,000 sequences. Bangui, Central African Republic: n = 254; Antananarivo, Madagascar: n = 380. Alpha-diversity (D) and beta-diversity (E) in the fecal microbiota and the independent association with given clinical cofactors. (F) Significantly different genera according to stunting status in a multivariate DeSeq2 analysis using a generalized linear model and a likelihood ratio test correcting for age, gender, country of origin, and sequencing run on the pooled dataset from Bangui and Antananarivo.

