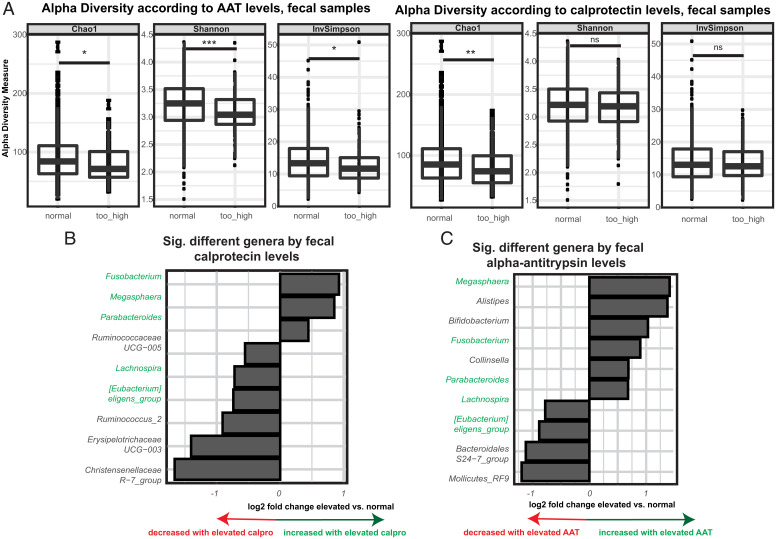
Fig. 2.
Fecal inflammatory biomarkers of EED and their association with the fecal microbiota. (A) Alpha-diversity measures in fecal samples according to AAT and calprotectin levels. Significantly different genera according to (B) calprotectin levels and (C) AAT levels in a multivariate DeSeq2 analysis using a generalized linear model and a likelihood ratio test correcting for age, gender, country of origin, stunting status, and sequencing run on the pooled dataset from Bangui and Antananarivo. Taxa similarly affected by calprotectin and AAT are indicated in green. ns, P > 0.05. *P < 0.05; **P < 0.01; ***P < 0.001

