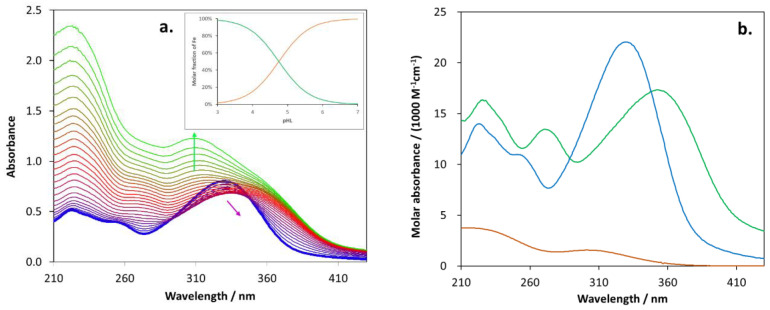
Figure 12.
The measured absorption spectra (a) at constant total ligand (trans-6) concentration (3.5·10−5 M) and various Fe3+ total concentration (from 0 M (blue) to 4.7·10−4 M (green)). The inset shows the molar fraction of free Fe3+ (orange) and 1:1 complex (FeL2+) (green) as functions of the protonated ligand concentration (pHL). Subfigure (b) shows the molar absorbance of Fe3+ (orange), ligand (blue), and FeL2+ adduct (green).

