Figure 13.
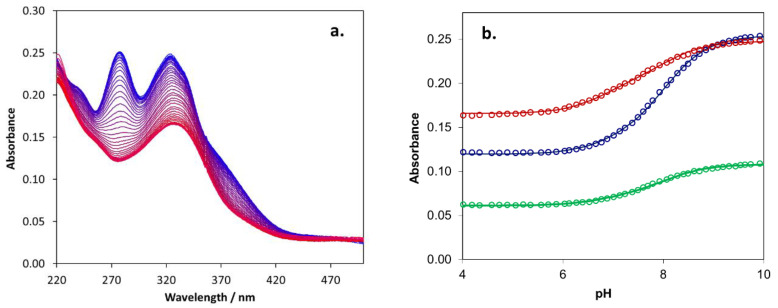
The measured absorption spectra (a) during potentiometric titration of ligand (trans-6). The pH changes from 10.0 (blue) to 4.0 (red). Subfigure (b) shows the measured (circles) and the calculated absorbance (lines) at three characteristic wavelengths (277 nm (blue), 324 nm (red), and 380 nm (green)).

