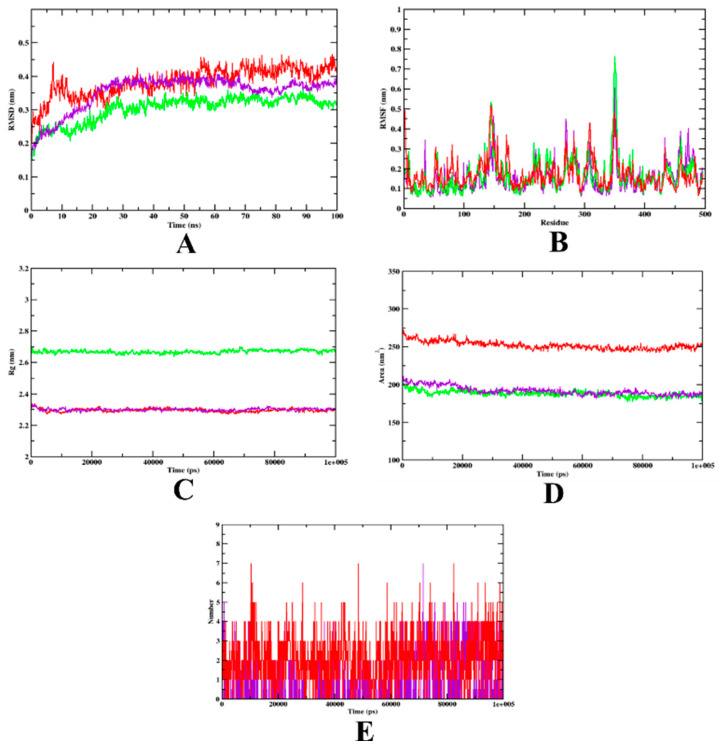
Figure 6.
Analysis of RMSD, RMSF, Rg, SASA, and the number of hydrogen bonds of isoeugenol- (purple) and acarbose-bound (red) α-amylase complexes, as well as apo-protein α-amylase (green), at 100 ns. (A) Time evolution of RMSD values of both the complexes along with the protein. (B) RMSF. (C) Radius of gyration (Rg). (D) SASA. (E) Hydrogen bonds.

