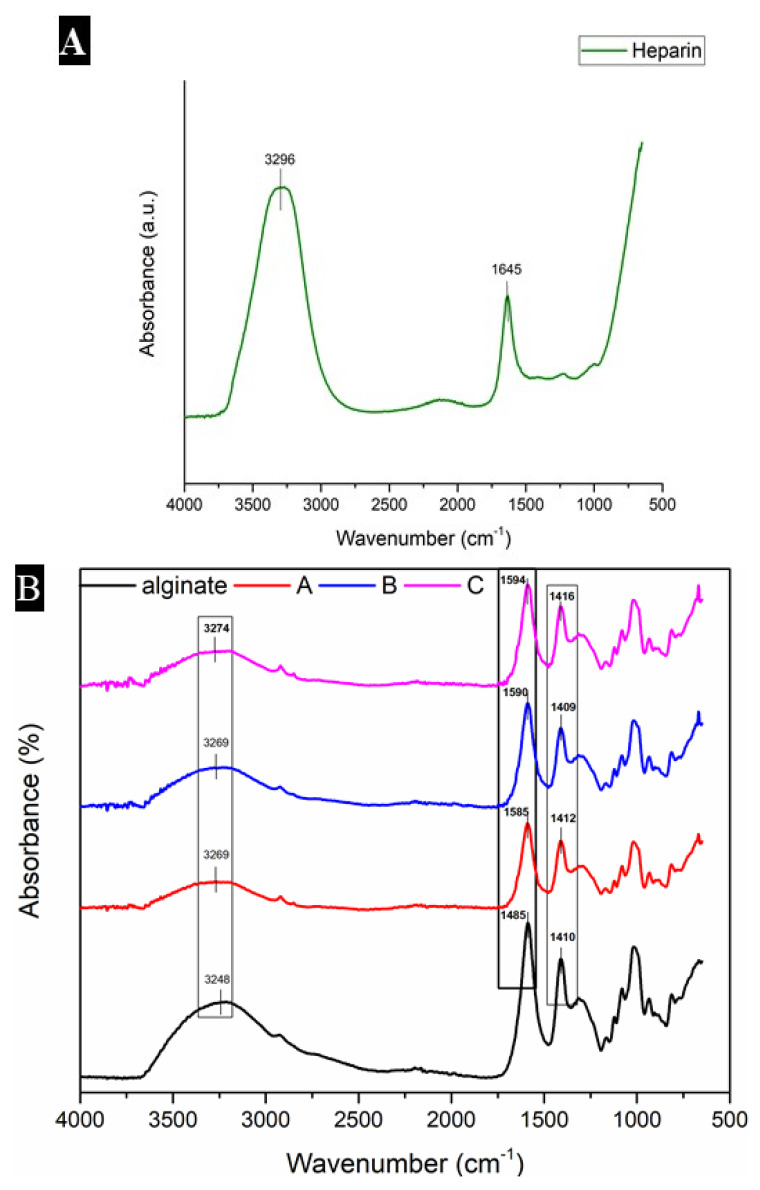
Figure 1.
This figure shows the FTIR analysis of heparin (A), and other samples (B). In Figure 1B, the spectra of “alginate” represent control, “A” represents sample A, “B” represents sample B and “C” represents sample C in the spectral region (4000–500 cm−1).

