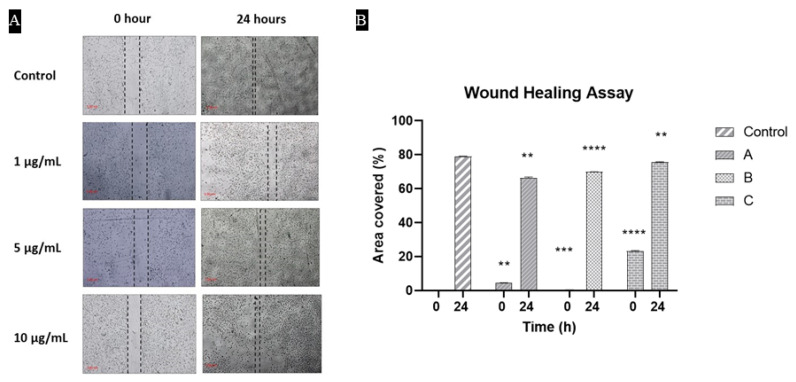
Figure 8.
The migration rate of NIH3T3 cells determined by a scratch wound assay where (A) represents the microscopic images of migrating cells in different groups while (B) is the bar graph representing the migration rate in each group. Each bar indicates the mean of area covered when compared with the control.

