Figure 5.
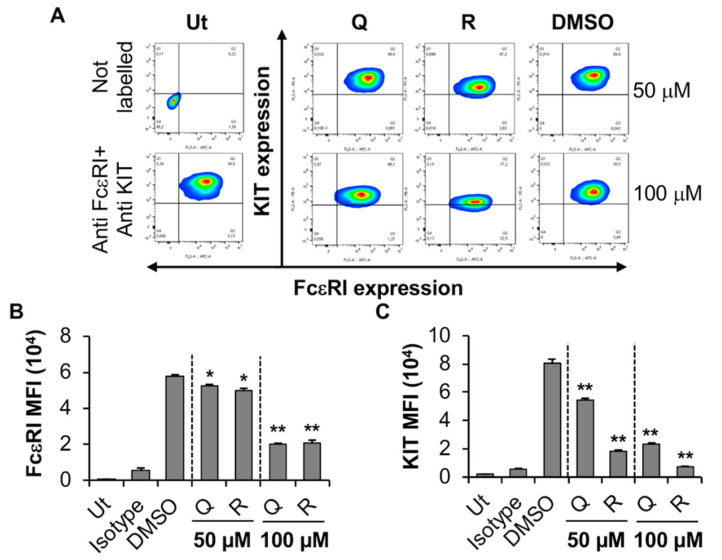
Effects of resveratrol and quercetin on FcεRI and KIT expression by LAD2. (A) LAD2 were treated with 50 or 100 μM quercetin (Q), resveratrol (R) or DMSO for 24 h followed by flow cytometry analysis. Ut represents untreated LAD2. FcεRI versus KIT expression contour plots were generated relative to the untreated unstained sample shown on the left-hand side panel. (B,C) Mean fluorescence intensity (MFI) of FcεRI and KIT expression by LAD2 treated as in A. n = 3. p values < 0.05 (*) and <0.01 (**) are relative to DMSO control.

