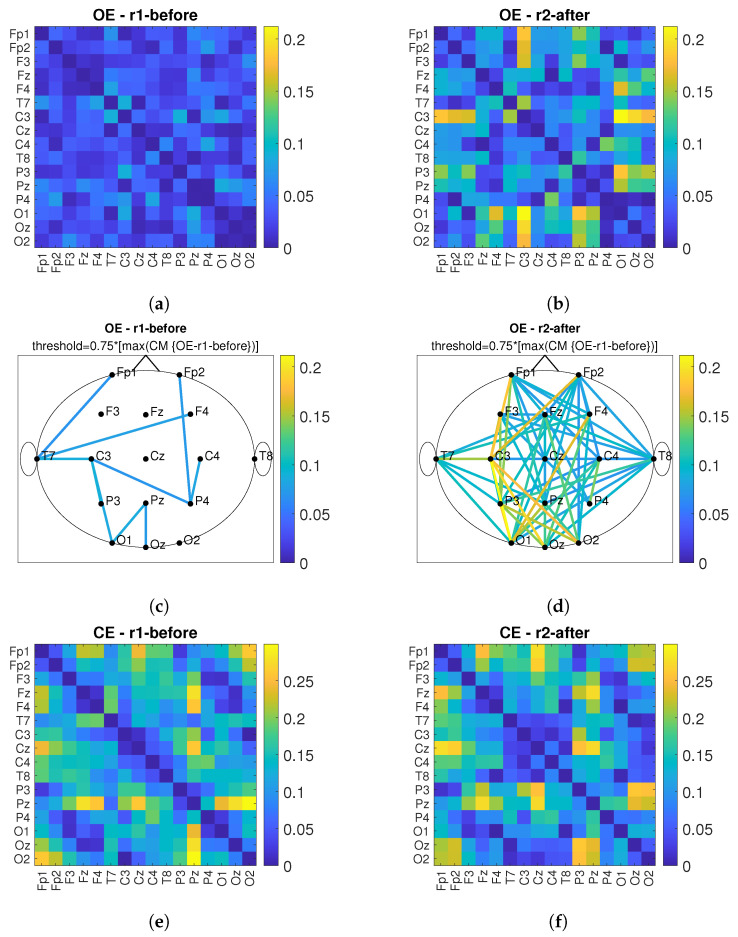
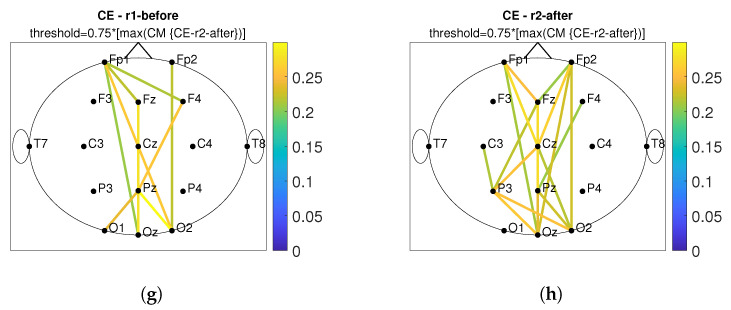
Figure 13.
The long-term effect of PBM stimulation in observing the connectivity values of imCPCC comparing the r1 before and the r2 after stimulation. The connectivity matrices (CM) and the head plot of the connections above threshold between electrode pairs are observed. (a) shows the CM under the OE condition for the r1 before stimulation and (c) shows the headplot of the connections, while (b,d) show the CM and the headplot of the connections for the r2 after stimulation. (e–h) show the CM or headplot of the CE condition.


