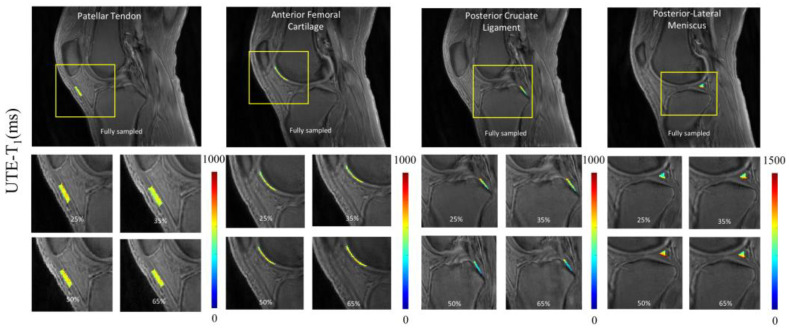
Figure 5.
Quantitative mapping of UTE-T1 parameter at different undersampling levels in four representative ROIs. A representative region is chosen from each group, namely tendon (patellar tendon), cartilage (anterior femoral cartilage), ligament (posterior cruciate ligament), and meniscus (posterior lateral meniscus). The T1 quantification values ranged between 500 to 1000 ms. The parameter maps show high correlation between different undersampled maps except posterior lateral meniscus, with values between 900 and 800, a margin of 100 ms.

