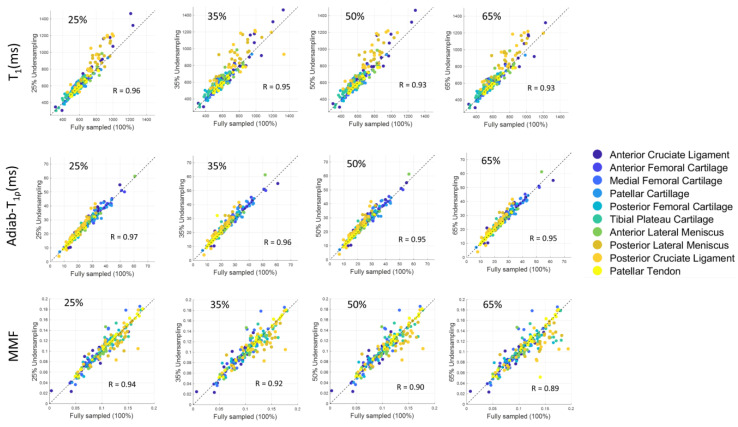
Figure 8.
Scatter plot for various quantification parameters (i.e., T1, T1ρ, and MMF) at different undersampling levels in ROIs from human knee joint. Correlation coefficient (R) recorded over 0.85 for all parameters in all four undersampling rates. While very few points can be recognized as outliers, parameters estimated in most of the ROIs showed high linearity between undersampled CS reconstruction and fully sampled reconstruction.

