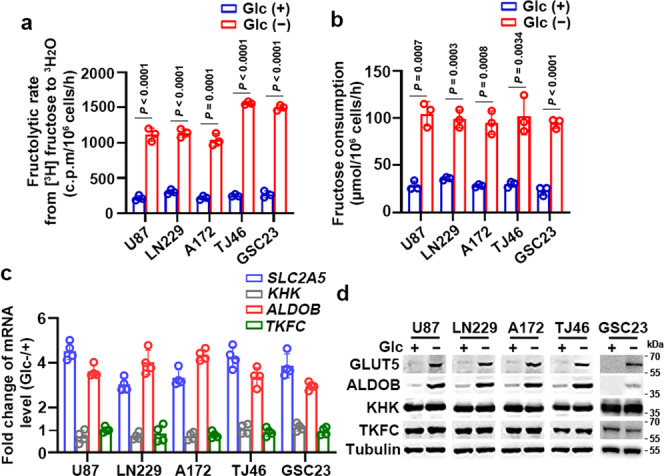
Fig. 1. Glucose deprivation promotes fructolysis.

a U87, LN229, A172, TJ46, and GSC23 cells were deprived of glucose for 18 h. The fructose metabolic rate was measured by monitoring the conversion of D-[5-3H] fructose to 3H2O and normalized to cell number. c.p.m, counts per minute. b U87, LN229, A172, TJ46, and GSC23 cells were deprived of glucose for 18 hours and then incubated with 10 mM of fructose for another 18 hours. The media were collected for analysis of fructose consumption. c, d U87, LN229, A172, TJ46, and GSC23 cells deprived of glucose for 18 hours were analyzed by quantitative PCR (c) and immunoblotting with indicated antibodies (d). Data were normalized with β-actin mRNA levels and presented as fold change induced by glucose deprivation (c). Glc (+) and Glc (−) represent glucose-supplemented (25 mM glucose) and -deprived (1 mM glucose) condition, respectively (a–d). Data represent the mean ± SD of three (a, b) or four (c) independent experiments. The experiments were repeated three times independently with similar results (d). P values were determined by the two-tailed Student’s t-test (a, b). Source data are provided as a Source Data file.
