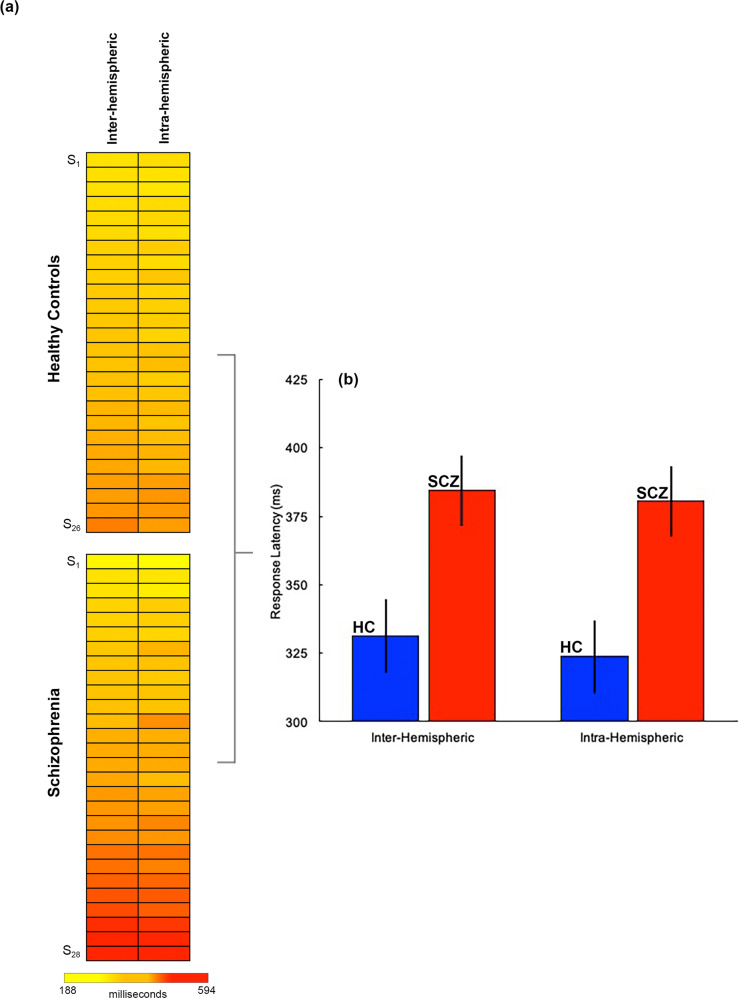
Fig. 2. Behavioral results.
a Response latencies across all healthy controls (n = 26) and patients (n = 28) are depicted in heat maps. In each group, data are arranged from fastest (top) to slowest (bottom) responses. b The data from a summarized in bar graphs (error bars ± s.d.) suggest a performance “cost” of ~50 ms in patients across both conditions (see Results for statistical information). As will be seen in Figs. 3 and 4, this relatively subtle cost in performance efficiency evinces highly exaggerated impacts on the activation-based differences.

