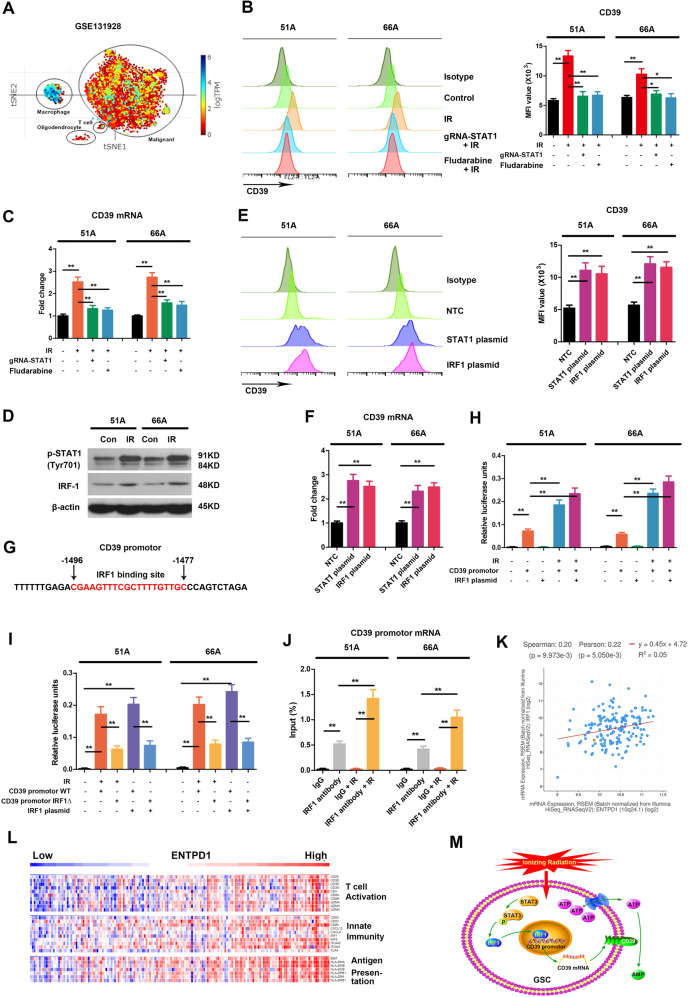
Fig. 2. STAT1 mediates radiation-induced CD39 expression via STAT1-IRF1 pathway.
A t-SNE generated from published data of single-cell RNA sequencing showed relative expression levels of ENTPD1, encoding CD39, in different clusters of human GBM. 51 A and 66 A cells were transfected with plasmid with gRNA targeting STAT1 for 48 h or pretreated with fludarabine, a STAT1 pathway inhibitor, 30 μM for 6 h, then were irradiated with 10 Gy. The level of CD39 protein on cell surface was detected using flow cytometry 24 hours following IR (B), and mRNA expression was measured using RT-qPCR 12 hours after IR (C). D Cells were irradiated with 10 Gy, and the protein levels of phosphorylated STAT1 and IRF1 were tested using western blot 12 hours after IR. Cells were transfected with NTC, pc-DNA-STAT1 or pc-DNA-IRF1 expression plasmids, then CD39 protein (E) and mRNA (F) expressions were determined. G The nucleotide sequence of putative IRF1 binding site in CD39 promotor was shown in red. H After 48 h transfection with luciferase reporter pGL3 plasmid carrying CD39 promotor, the luciferase activities in cell lysate were measured by dual-luciferase reporter system when cells were irradiated with 10 Gy or co-transfected with IRF1 expression plasmid. The firefly luminescence signal was normalized based on the Renilla luminescence signal. I After transfection with pGL3-CD39 promotor WT or pGL3-CD39 promotor IRF1∆ plasmid, the luciferase activities were measured following IR or IRF1 plasmid transfection. J ChIP assay was performed using anti-IRF1 antibody, the results of qPCR products were shown using primers flanking the IRF1 binding site. K Correlation of CD39 and IRF1 expressions from TCGA database was analyzed in GBM patients. L The expressions of signature immune gene sets based on ENTPD1 expression levels from The Cancer Genome Atlas (TCGA) database were shown using heatmap according to z-score normalized log-cpm values. n = 170. M IR activates STAT1-IRF1-CD39 axis to form an immunosuppressive TME. *P < 0.05, **P < 0.01.

