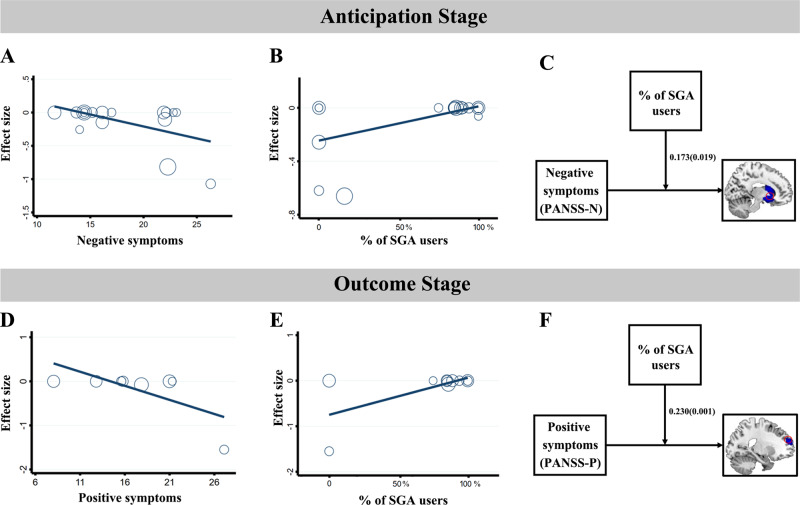
Fig. 3. Correlations and moderation analyses between clinical symptoms and brain activity during reward anticipation and reward outcome.
A Scatter plot showing a significant negative association between anticipation-evoked activity and negative symptom severity (PANSS-N) in the VS (MNI coordinates: x = 16, y = 14, z = −6, r = −0.507, p = 0.038). B Scatter plot showing a significant positive association between anticipation-evoked activity and the % (percentage) of SGA users (the proportion of SZ who had ever received SGA) in the VS (MNI coordinates: x = 16, y = 2, z = 0, r = 0.533, p = 0.019). C Conceptual diagram of the moderating effect of the % of SGA users on the relationship between negative symptoms and striatum hypoactivation during reward anticipation. D Scatter plot showing a significant negative association between outcome-evoked activity and the positive symptom severity (PANSS-P) in the mPFC (MNI coordinates: x = 0, y = 46, z = −10, r = −0.681, p = 0.043). E Scatter plot showing a significant positive association between outcome-evoked activity and the % of SGA users in the mPFC (MNI coordinates: x = 0, y = 46, z = −10, r = 0.656, p = 0.028). F Conceptual diagram of the moderating effect of % of SGA users on the relationship between positive symptoms and mPFC hypoactivation during reward outcome. SZ schizophrenia, HC healthy controls, SGA second-generation antipsychotic, mPFC medial prefrontal cortex.

