FIGURE 5.

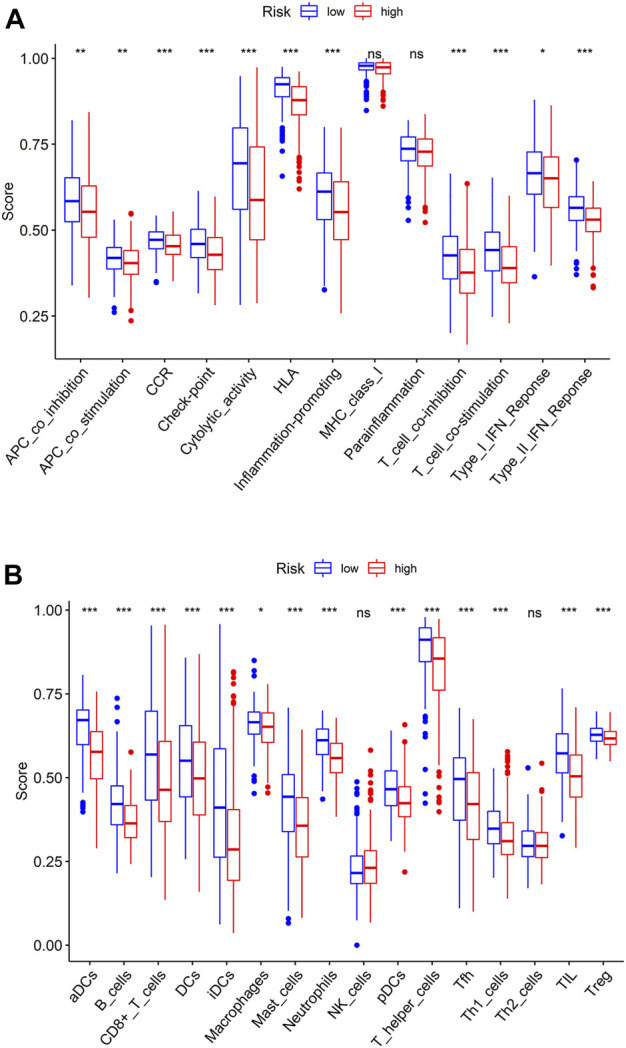
ssGSEA in high- and low-risk groups. (A) Immune-related gene sets in high- and low-risk groups; (B) Boxplot of immune cell differences in the two risk groups.

ssGSEA in high- and low-risk groups. (A) Immune-related gene sets in high- and low-risk groups; (B) Boxplot of immune cell differences in the two risk groups.