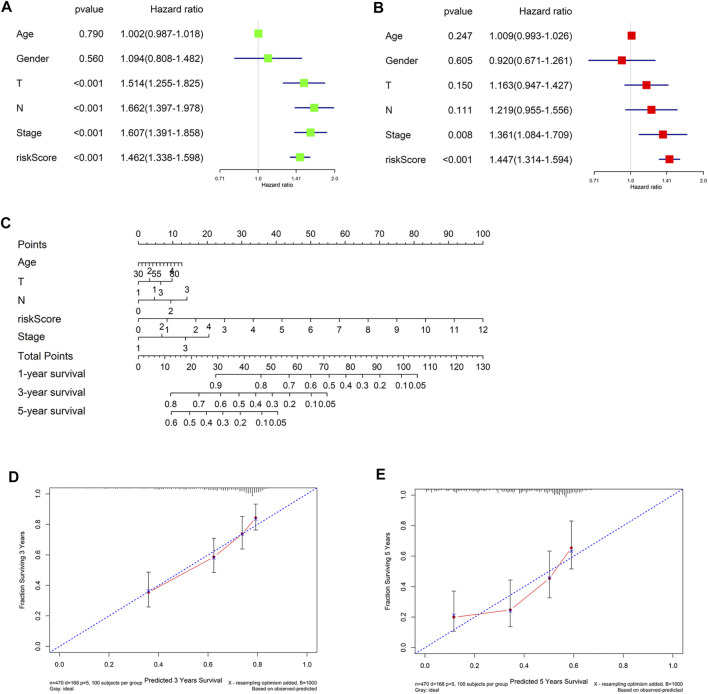
FIGURE 7.
Construction and evaluation of the nomogram. (A,B) Univariate and multivariate Cox regression analyses for riskscore and clinicopathological features; (C) The nomogram constructed from riskscore and clinicopathological features was used to predict 1-, 3-, and 5-year survival of patients in the training cohort; (D,E) The calibration curve was used to describe the consistency between nomogram prediction of 3- and 5-year survival and actual survival.

