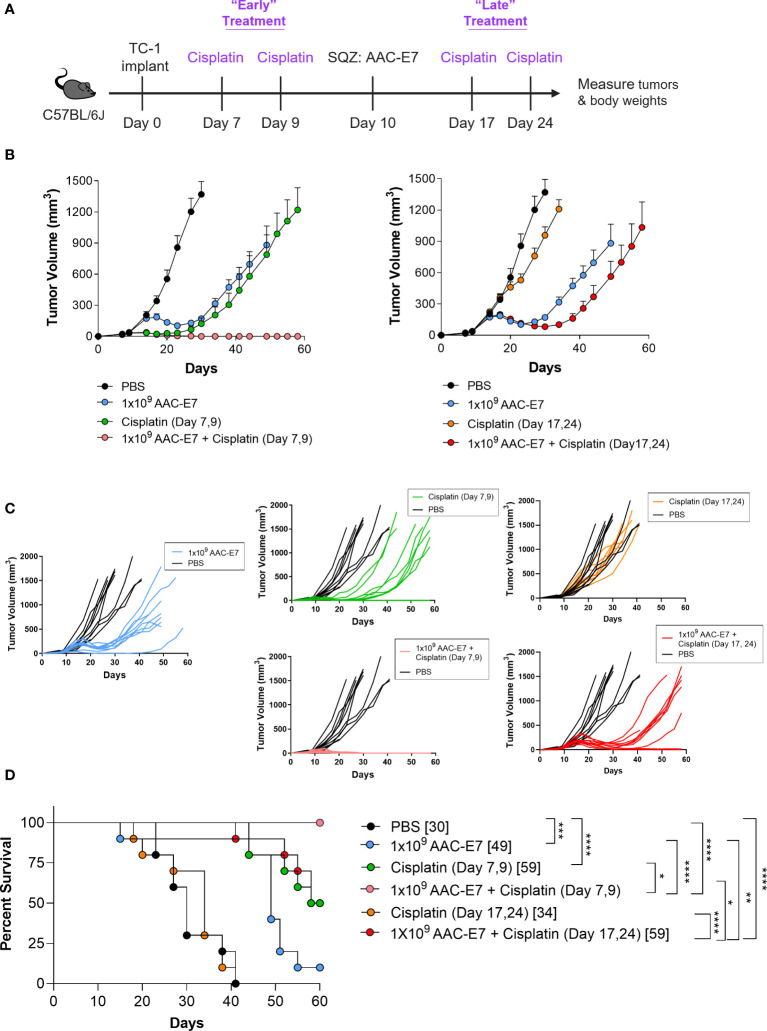
Figure 6.
Synergistic therapeutic effect of AACs and chemotherapy combination. (A) Schematic of Cisplatin and AAC-E7 dosing. Early (two doses: day 7, 9 post TC-1 implant) and late (two doses: day 17, 24 post TC-1 implant) Cisplatin dosing was administered as monotherapy or in combination with AAC-E7. (B) Tumor growth curves for PBS, AAC-E7 and Cisplatin monotherapy, or combination therapy. The figures show the same PBS and AAC-E7 monotherapy treatment groups overlayed with early (left) and late (right) Cisplatin dosing. (C) Spider plots of individual mice per each treatment group. (D) Median survival (n = 10 mice per group). *P < 0.05, **P < 0.01, ***P < 0.001, ****P < 0.0001, Mantel-Cox test for median survival.

