Figure 5.
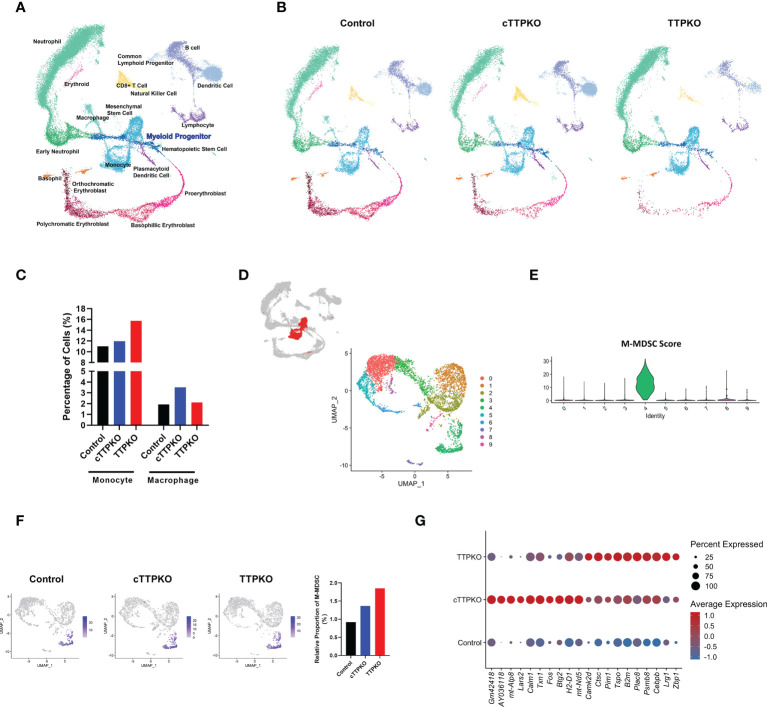
Transcriptional profiling of bone marrow-derived cells reveals distinct differentiation landscapes in bone marrow of TTPKO/cTTPKO mice as well as in M-MDSCs. (A) Integrated Seurat analysis of samples from total mouse bone marrow displayed in UMAP. (B) UMAP of control, cTTPKO, and TTPKO mice bone marrow samples displayed individually. (C) The percentage of neutrophils, monocytes, and macrophages from control, cTTPKO, and TTPKO mice, plotted as a percentage of total cells sequenced in each sample. (D) Subpopulations of monocyte clusters are shown in red, and 10 distinct sub-clusters were reconstructed and displayed as UMAP. (E) Expression of M-MDSC specific panel (score) is shown in violin plot. (F) M-MDSC populations of control, cTTPK, and TTPKO mice are individually displayed in UMAP and compared graphically. (G) Dot plot showing top genes in which M-MDSC populations are differentially expressed in control, cTTPKO, and TTPKO mice.

